CloudWatch Dashboards
CloudWatch Dashboards
This is the final part of this workshop, where we will create a simple Dashboard to manage the Metrics and Alarms we have created, specifically the Error Logs we created in the previous section.
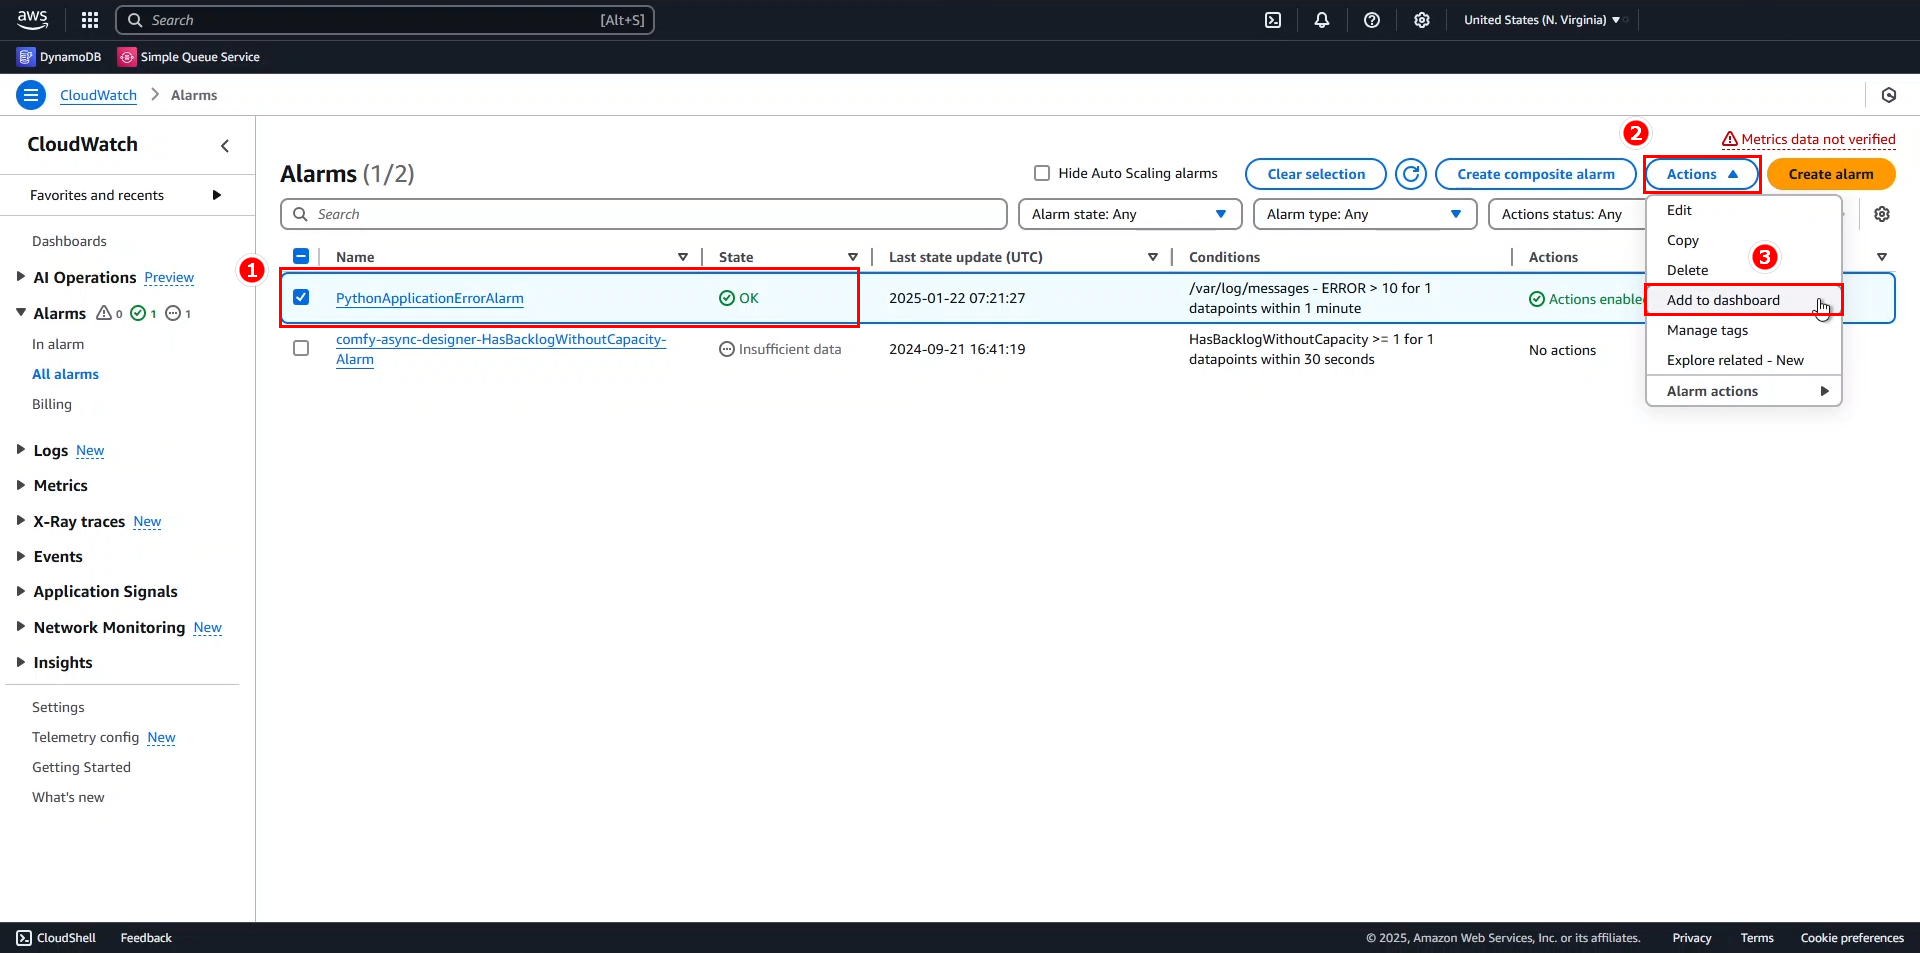
Add the alarm we just created to the Dashboard.
- Select PythonApplicationErrorAlarm.
- Expand Actions.
- Select Add to dashboard.
- In the Add to dashboard dialog, select Create new.
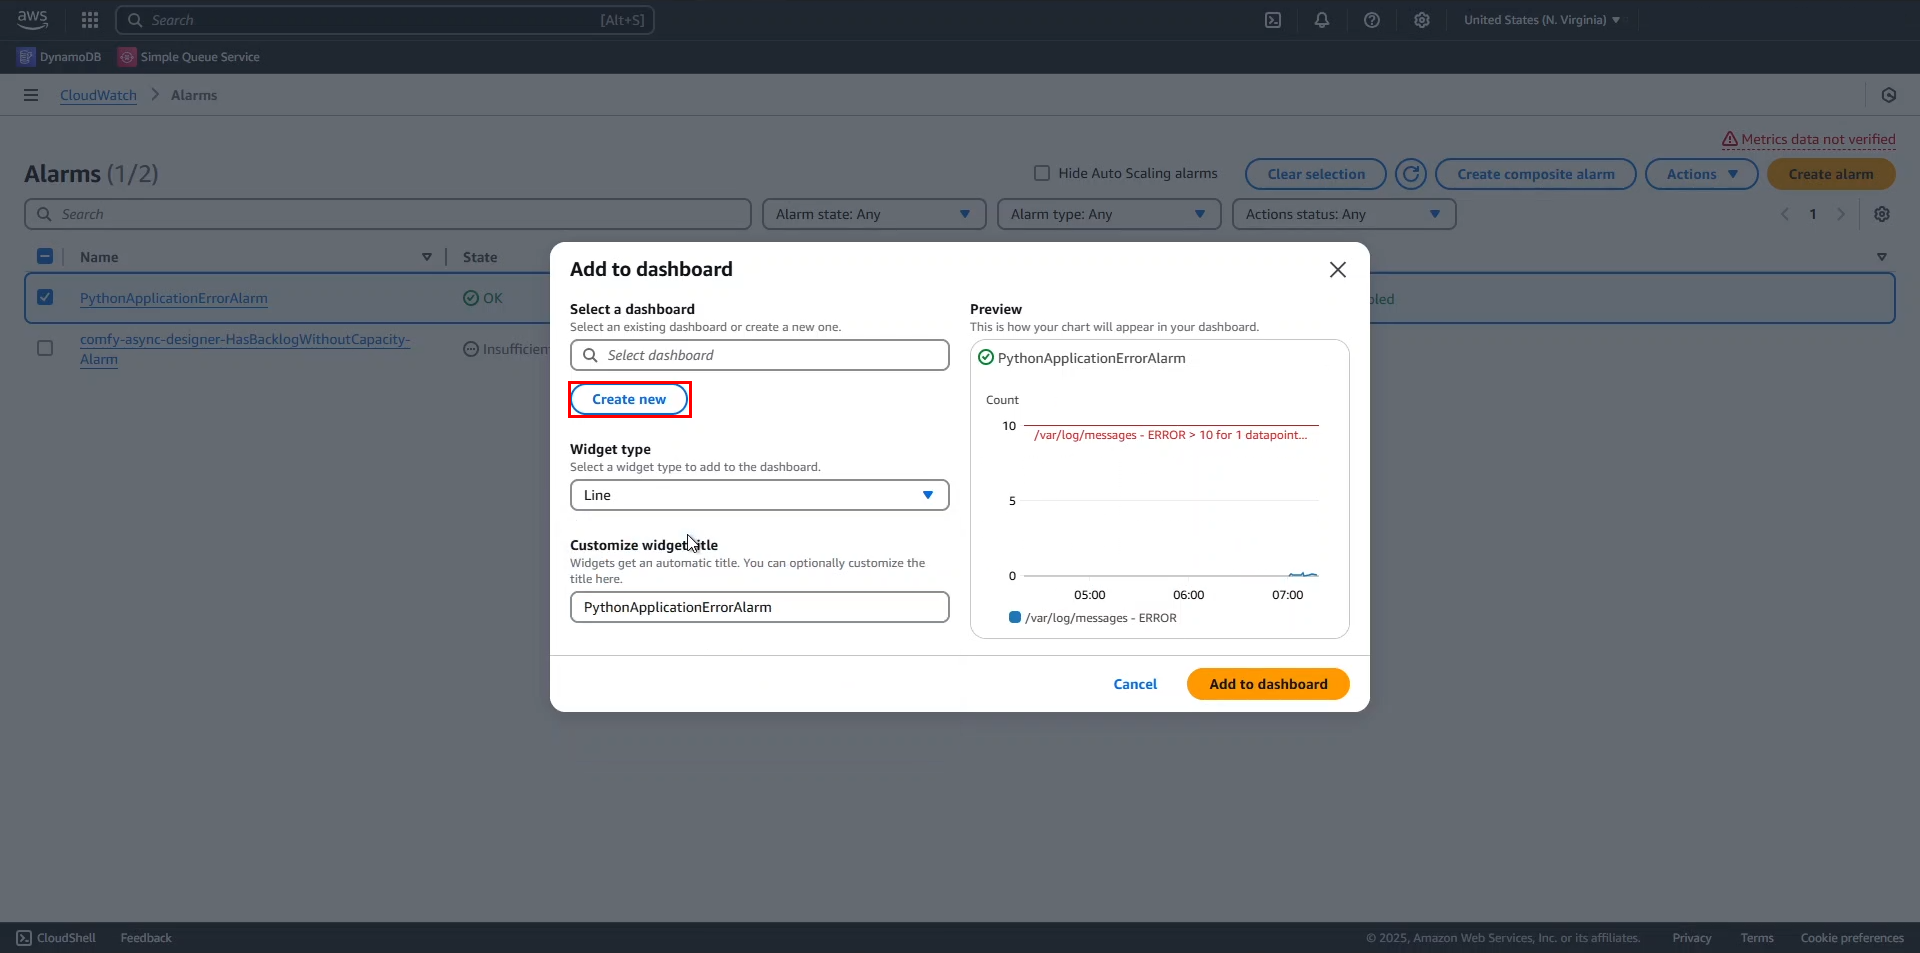
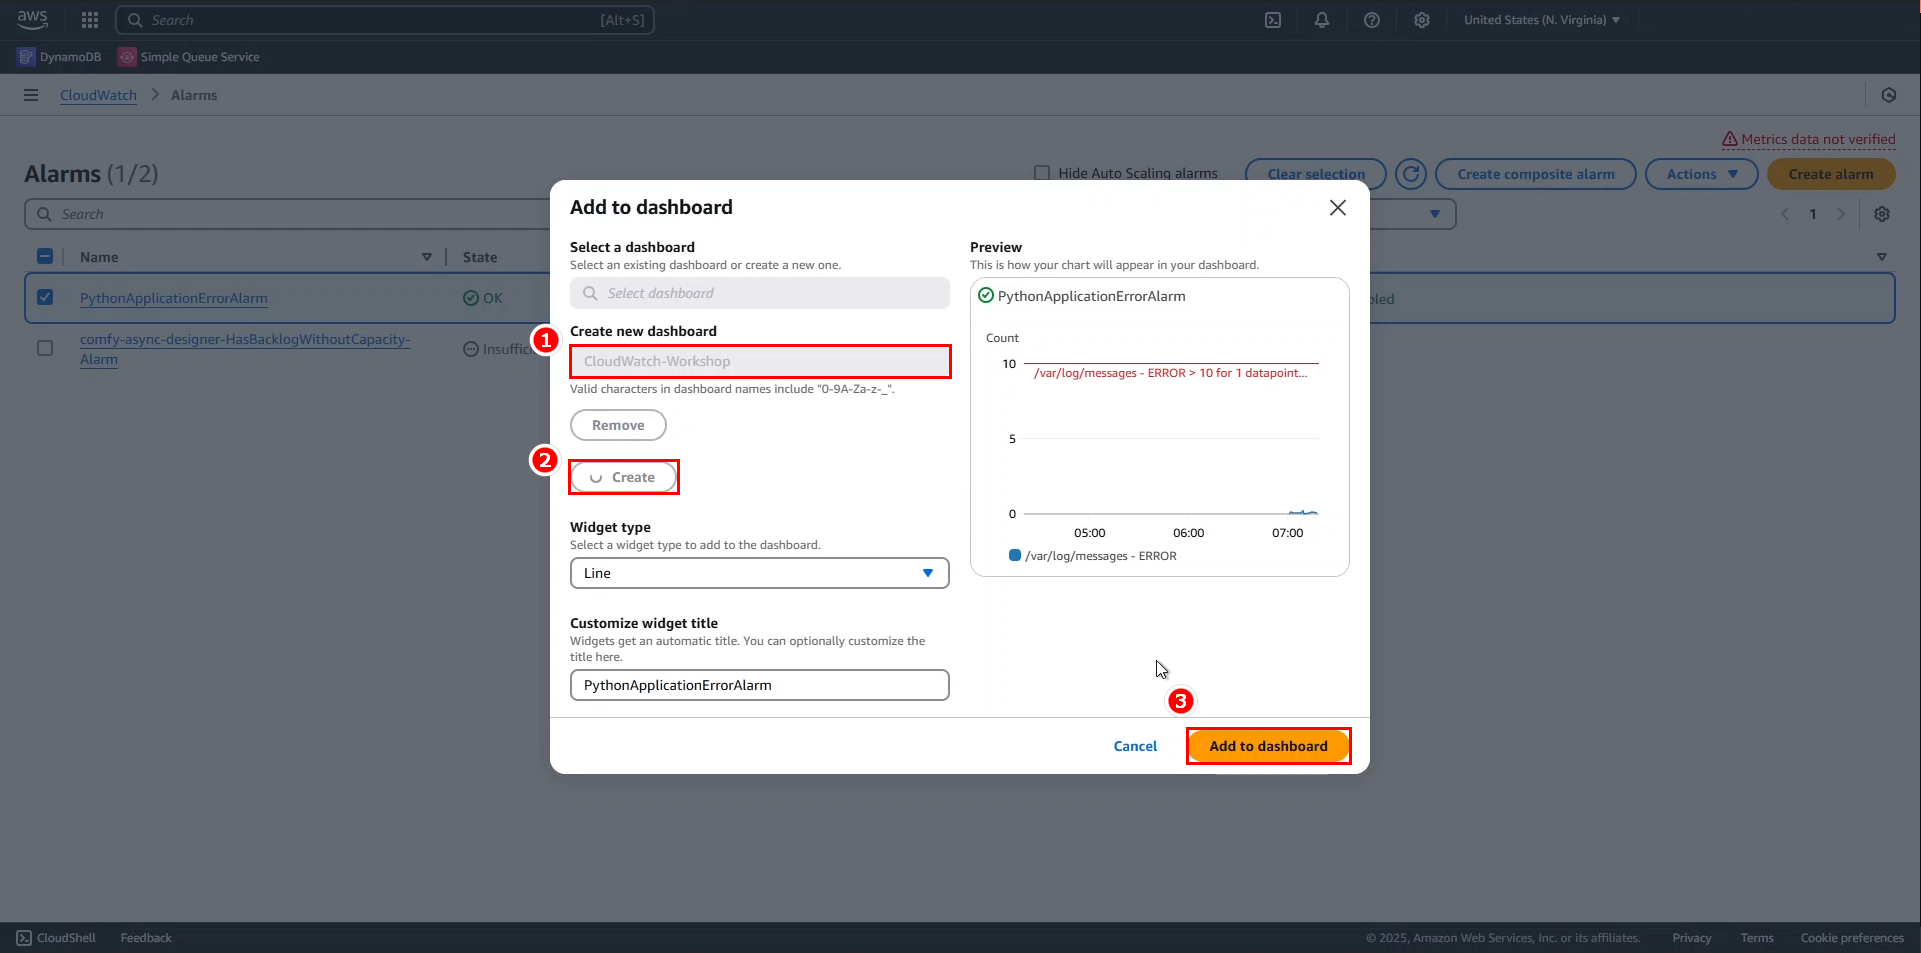
Enter the name for the dashboard as
CloudWatch-Workshop.- Click Create.
- Click Add to dashboard.
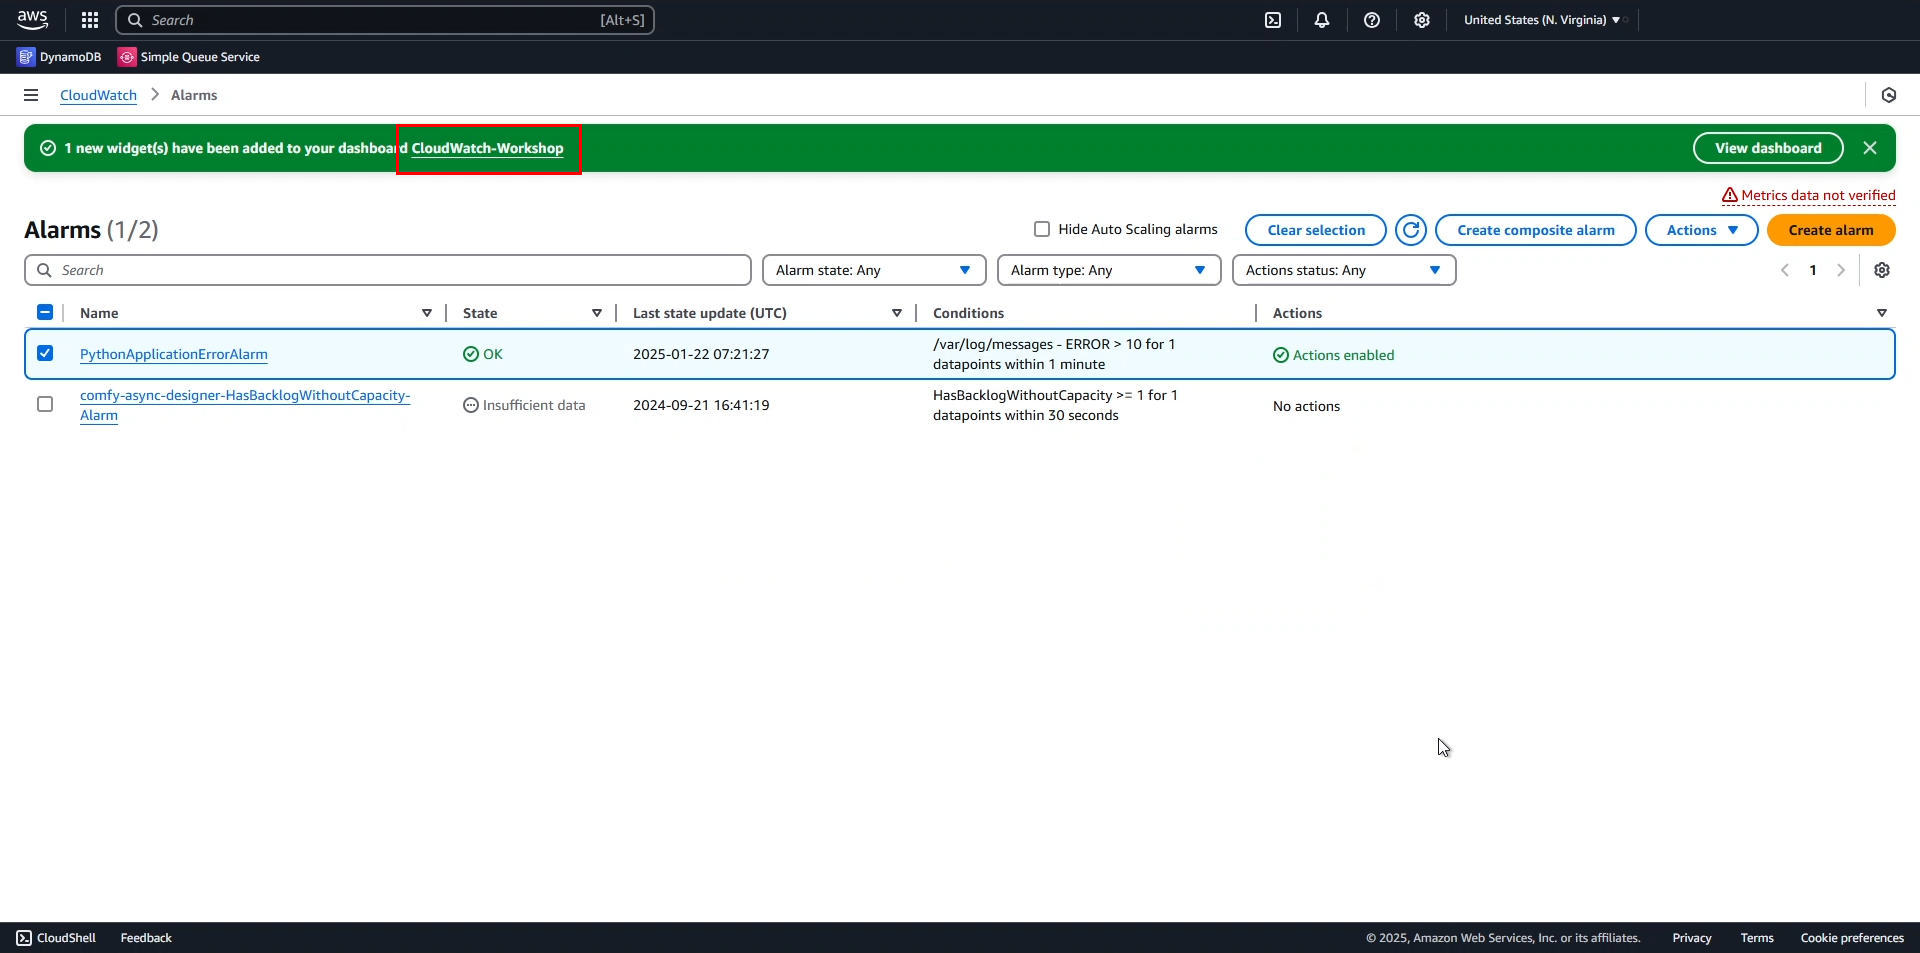
Here is our dashboard.
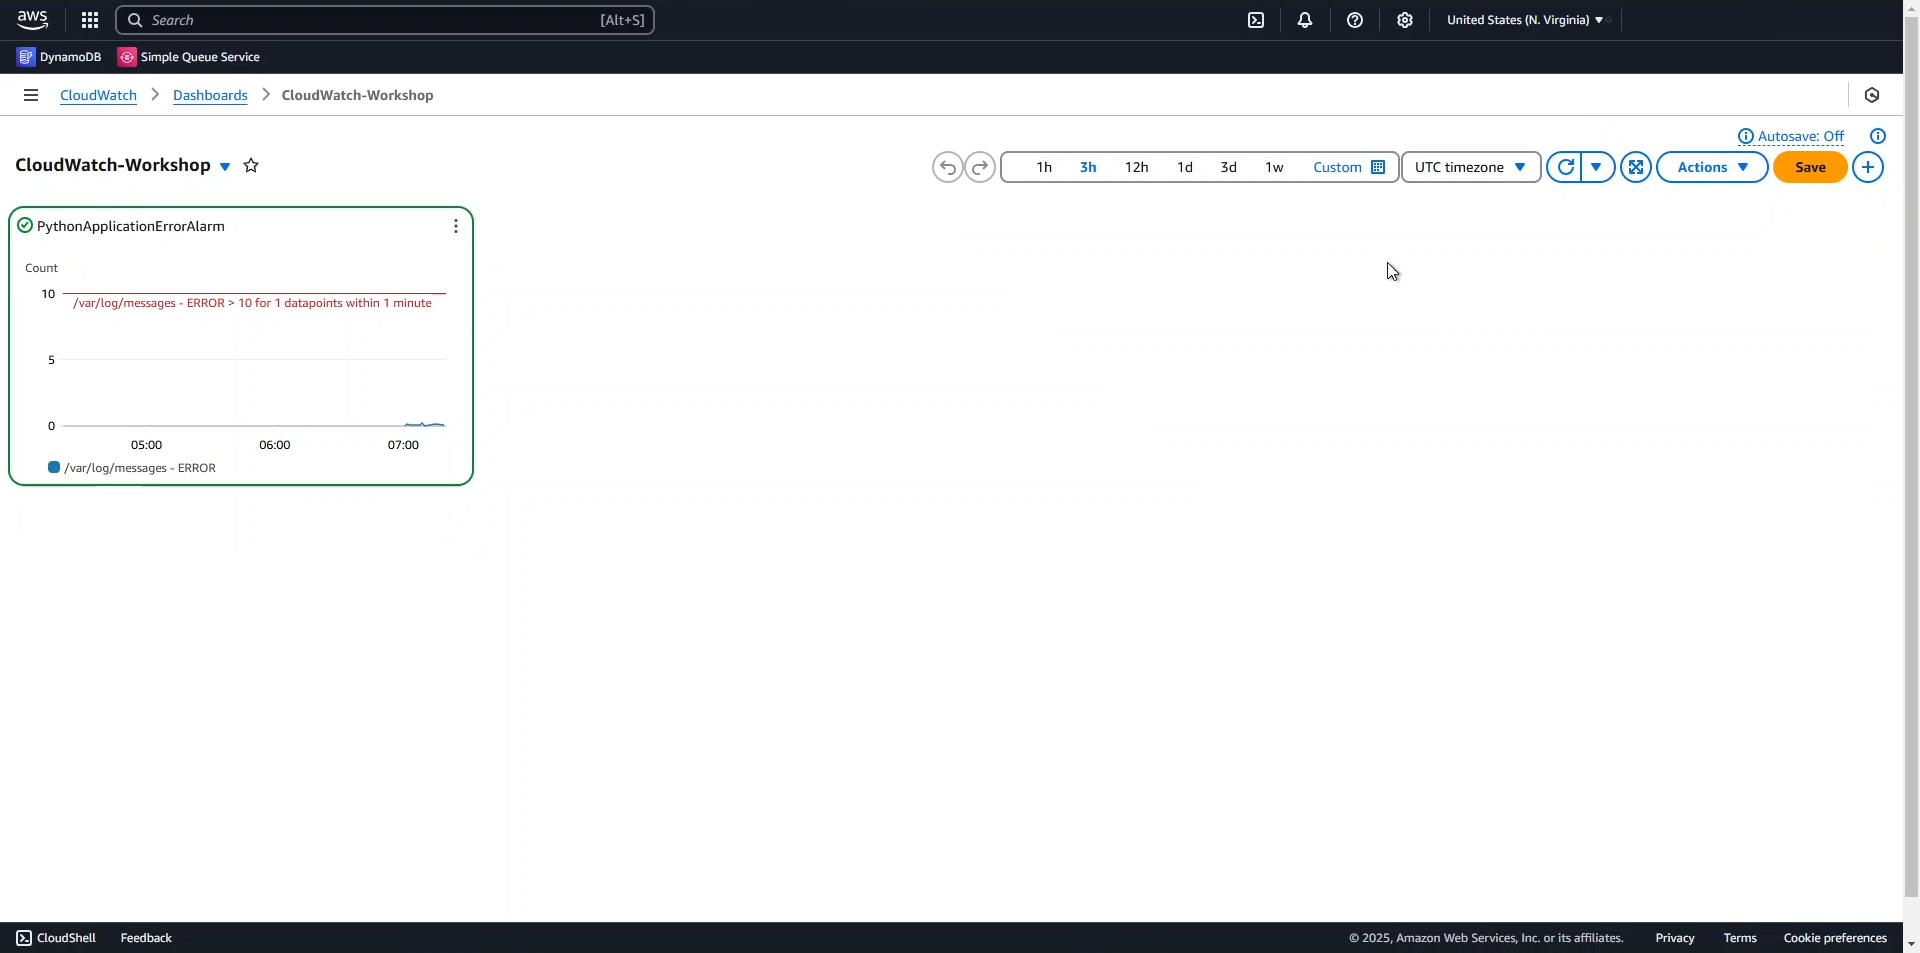
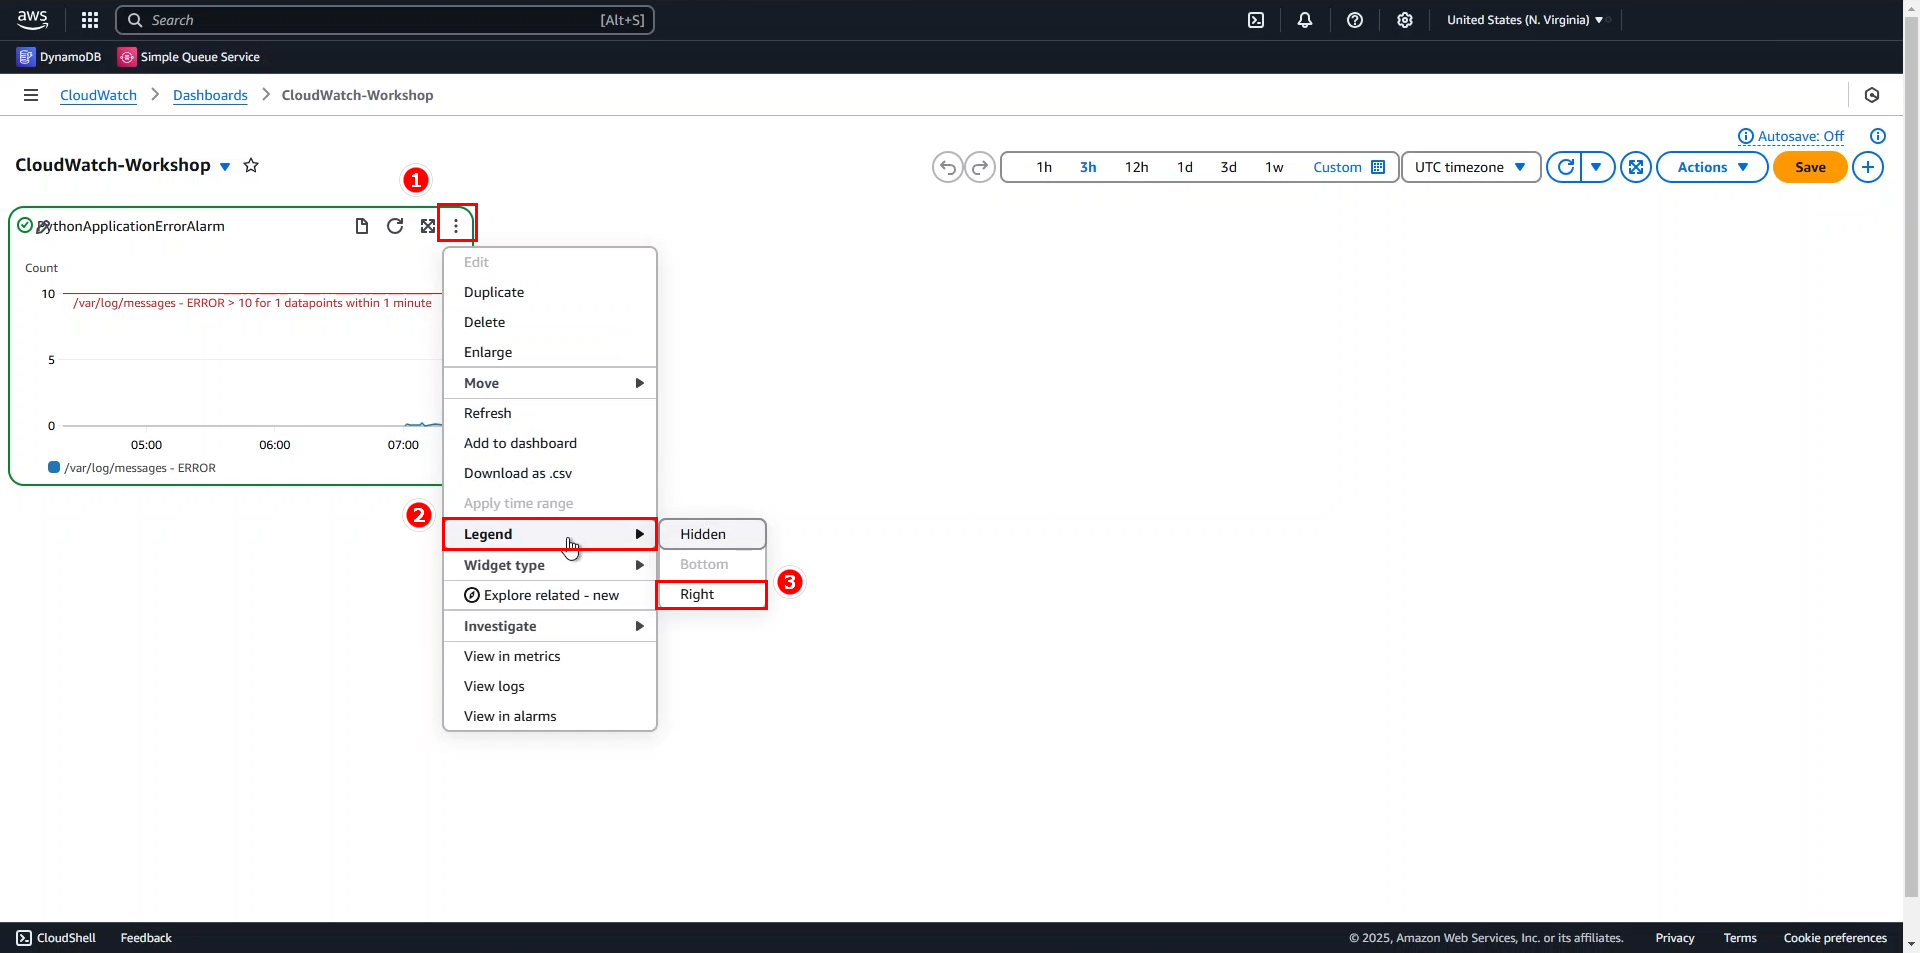
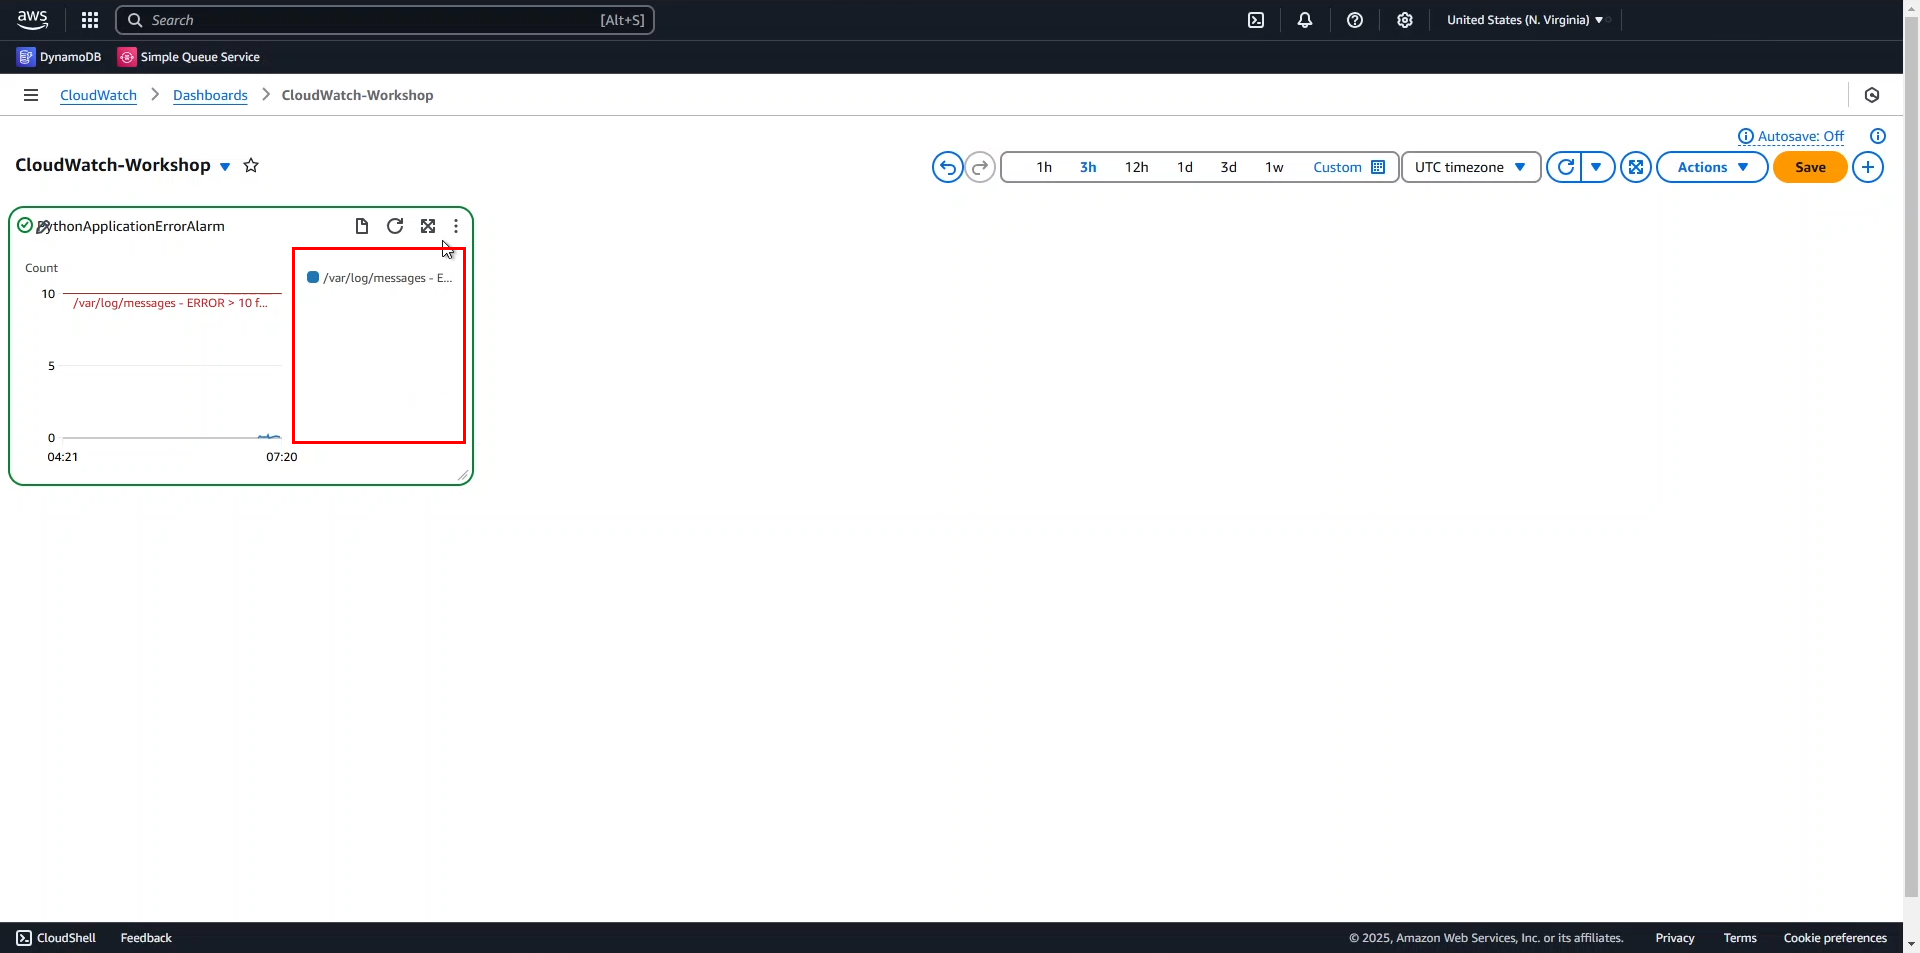
You can perform several actions on this widget.
If you’ve made it this far, congratulations on completing this workshop!