CloudWatch Metric Filter
CloudWatch Metric Filter
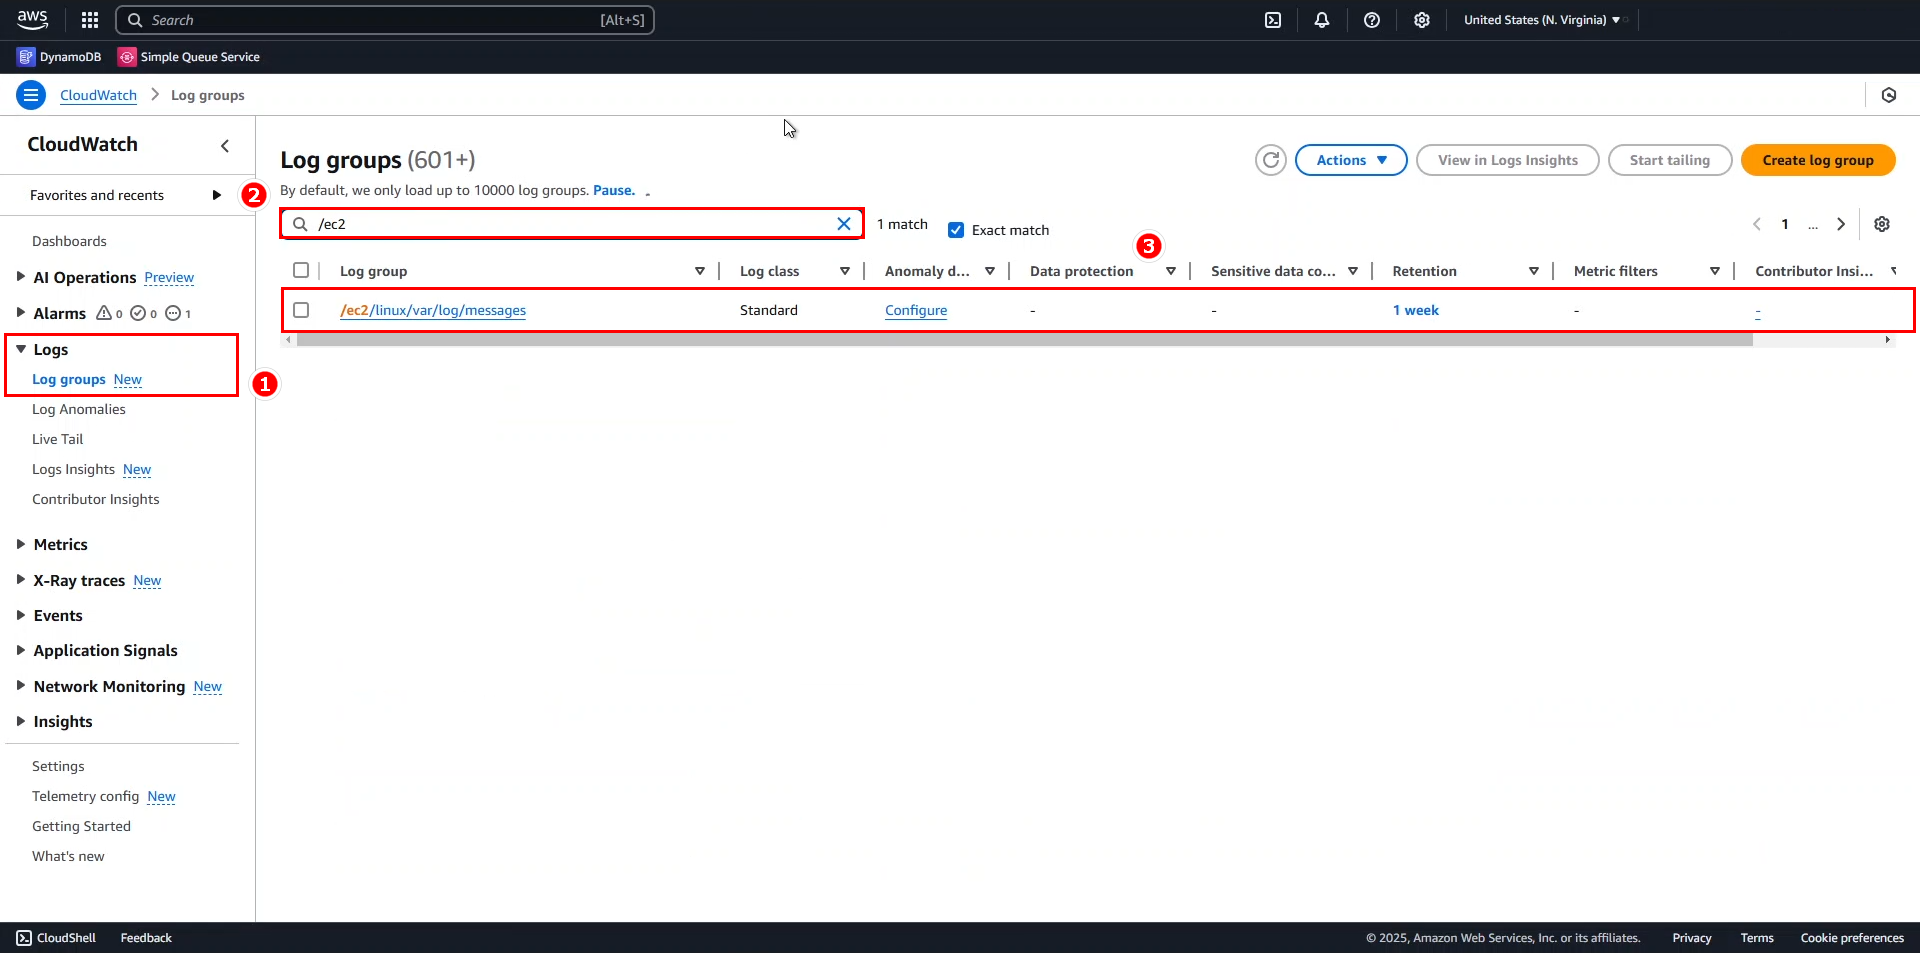
Return to the main screen of CloudWatch
- Select Log groups
- Search for
/ec2. - Select /ec2/linux/var/log/messages
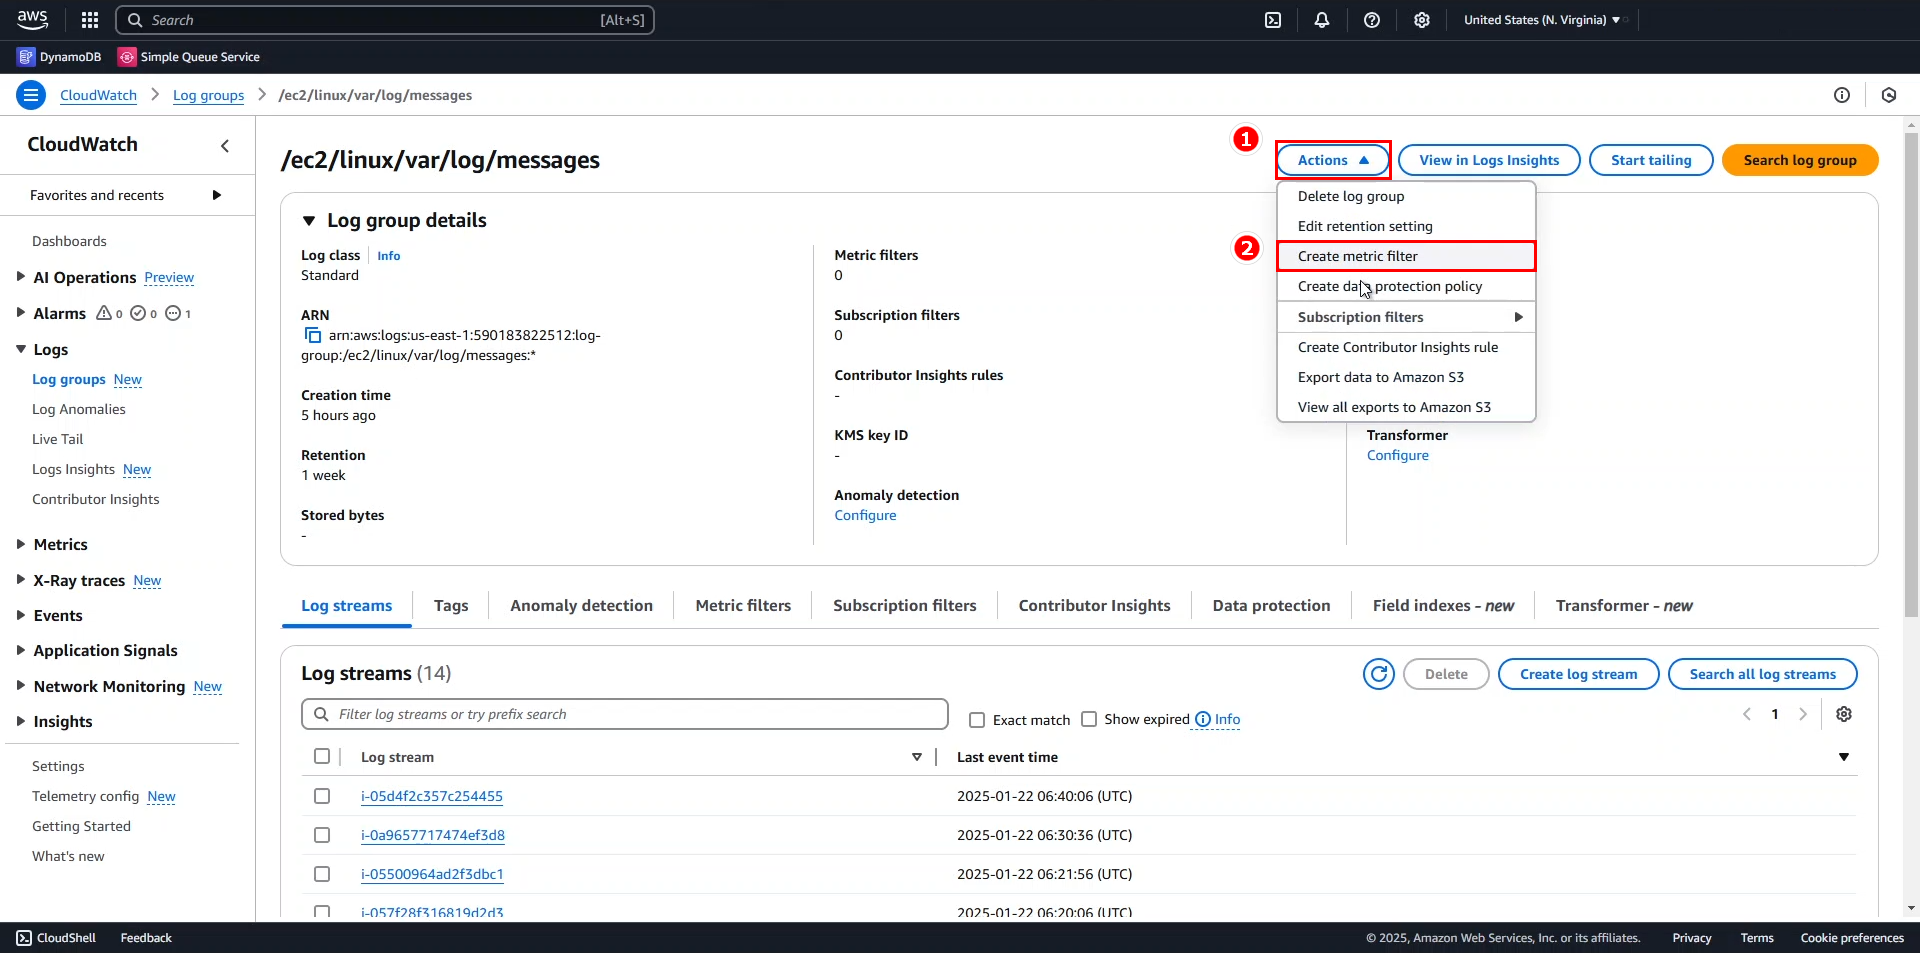
In the interface of /ec2/linux/var/log/messages
- Click on Actions.
- Click Create metric filter.
In the Define Pattern section, enter the following information:
- Filter pattern: select ERROR from the dropdown.
- Test pattern: select any instance, but it’s recommended to choose the instance where we created processes in the previous two steps.
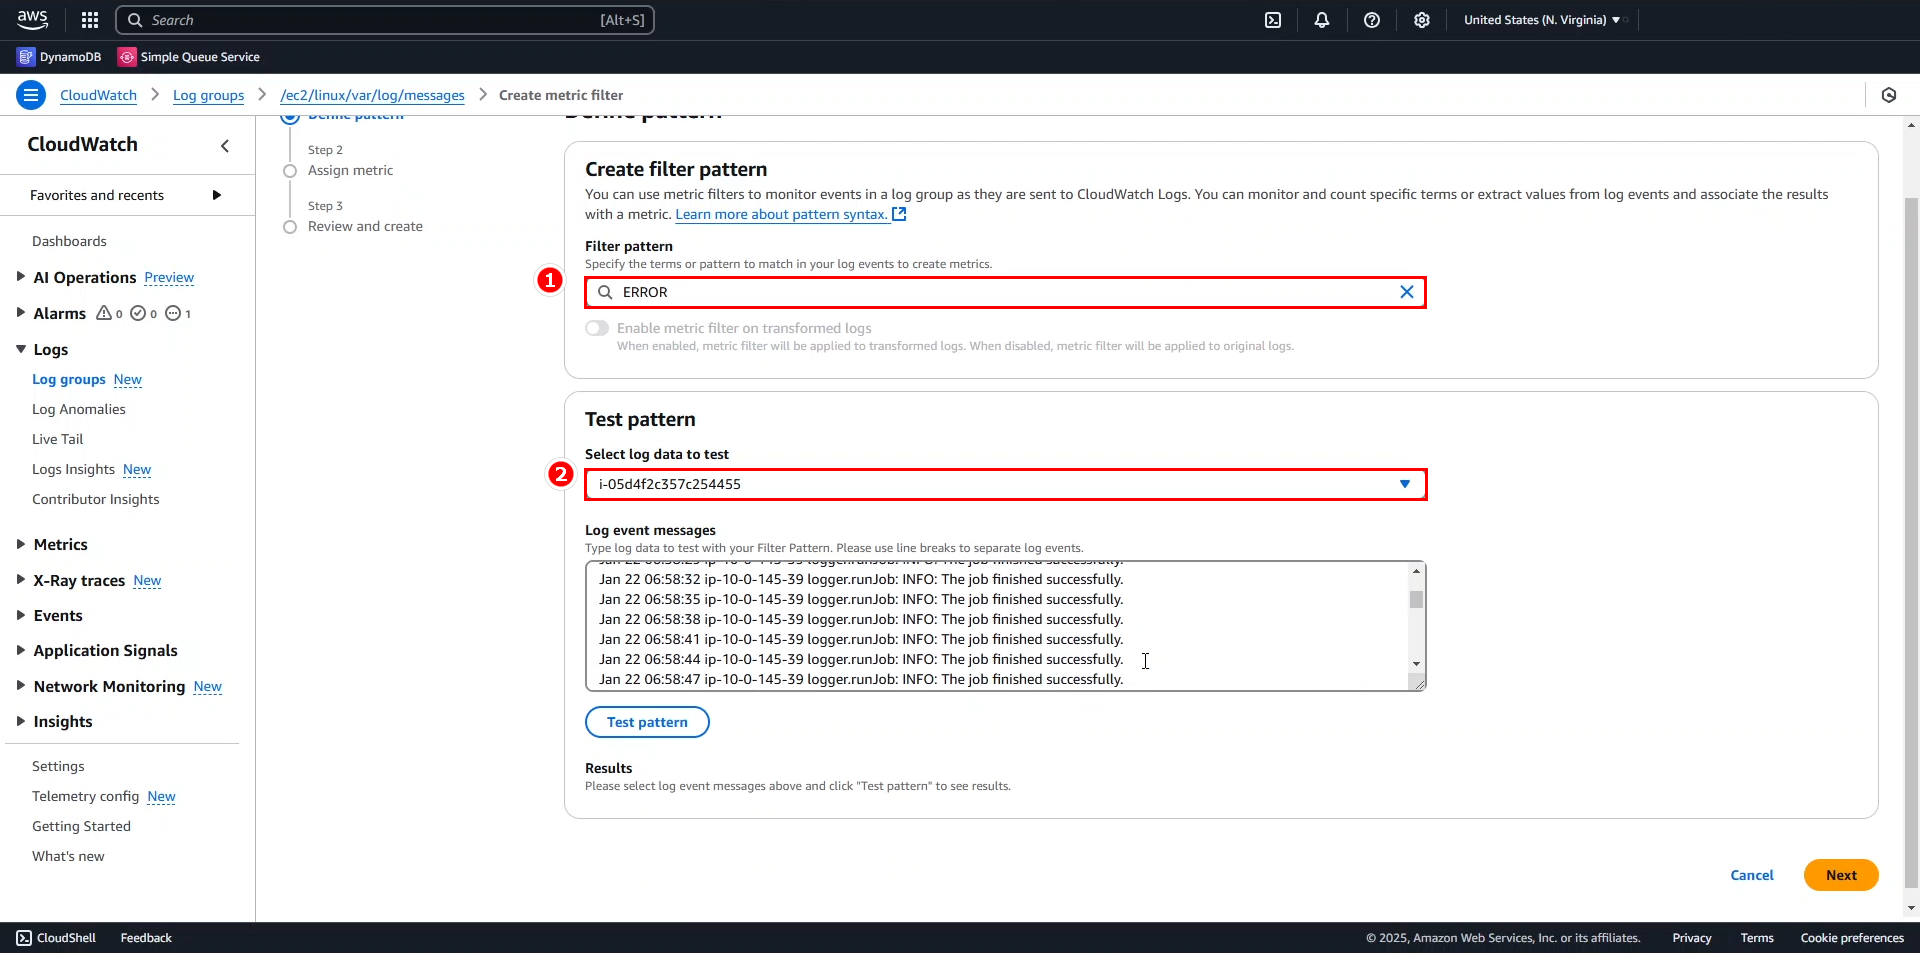
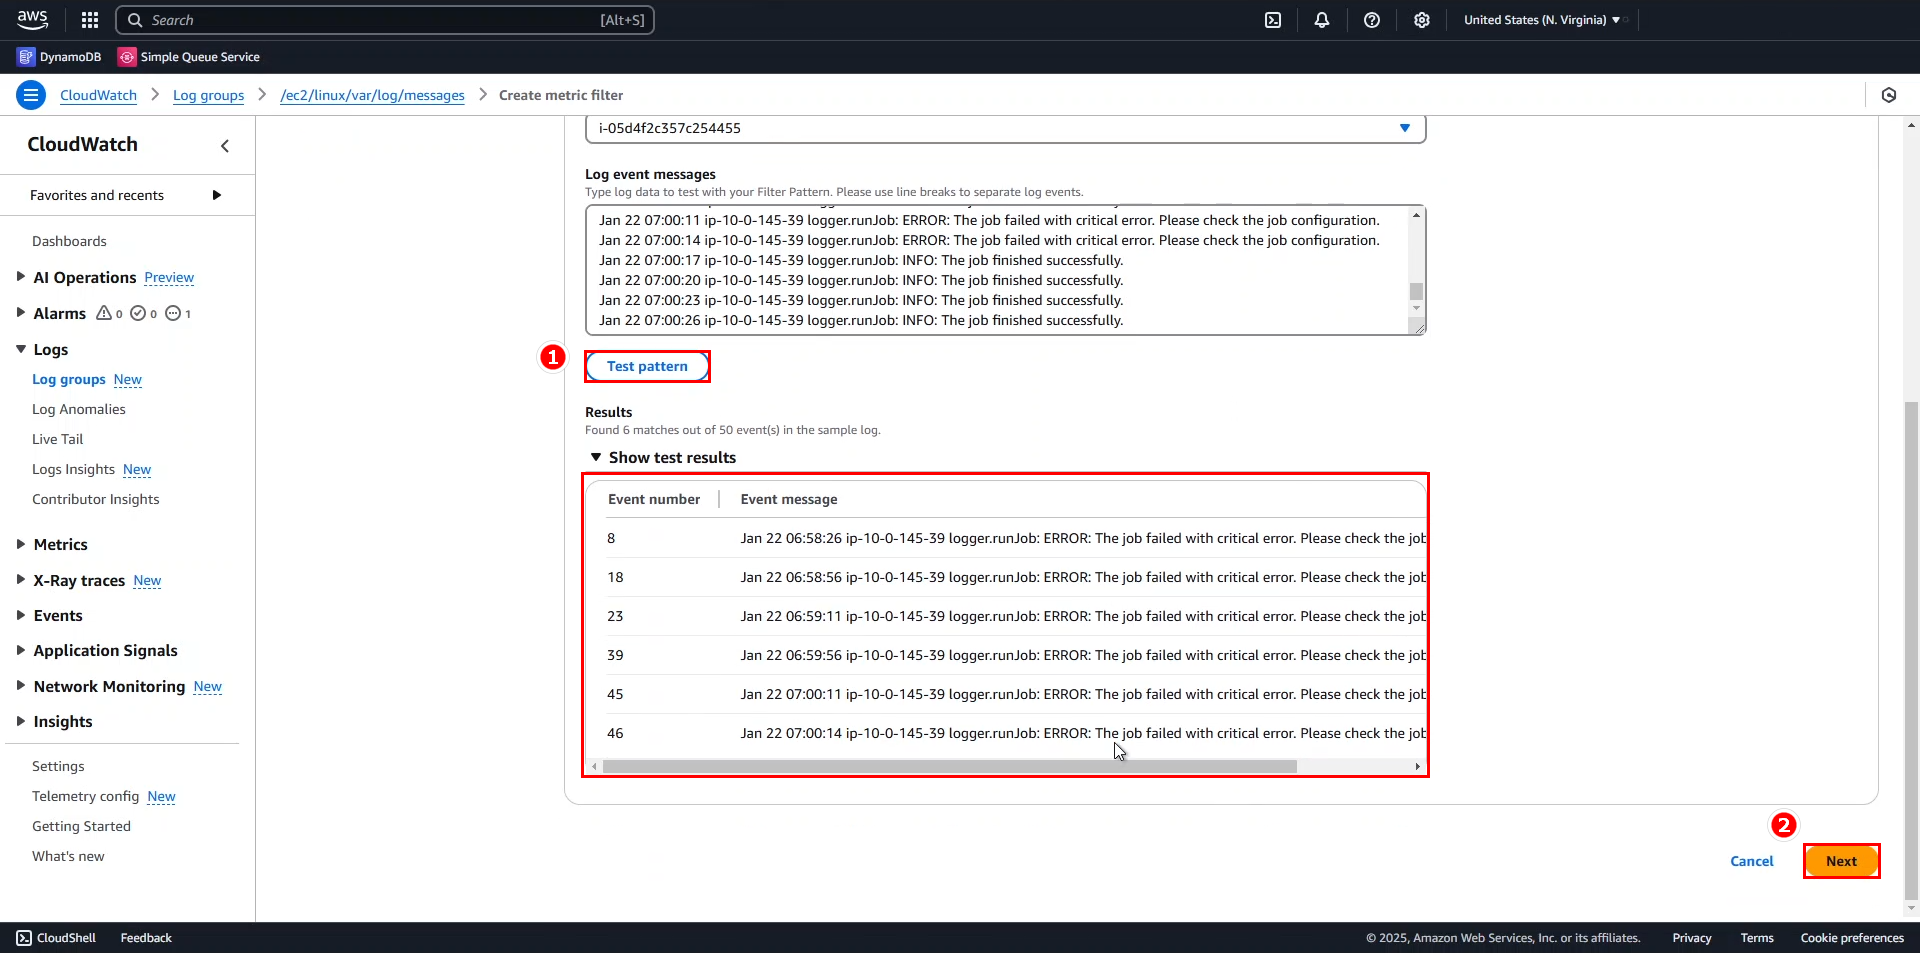
- Click Test pattern to check if the filter works properly.
- In the Create filter name section of Assign metric, enter
PythonAppErrors.
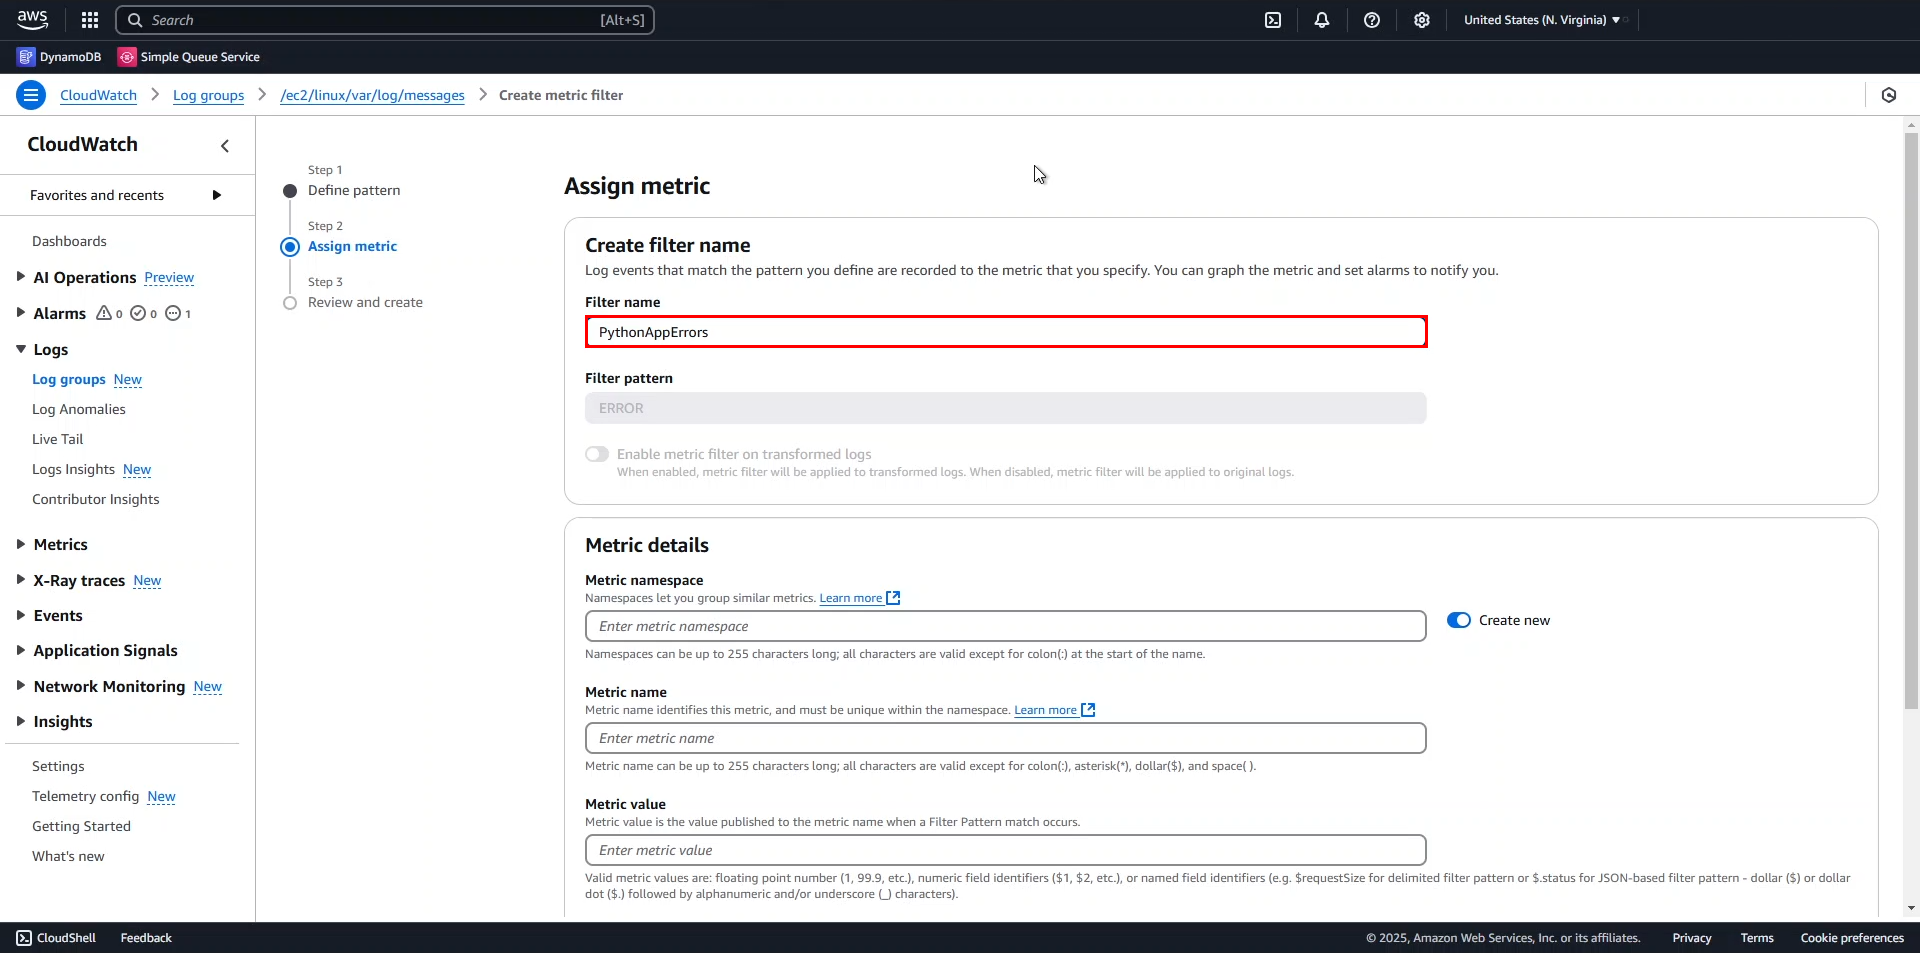
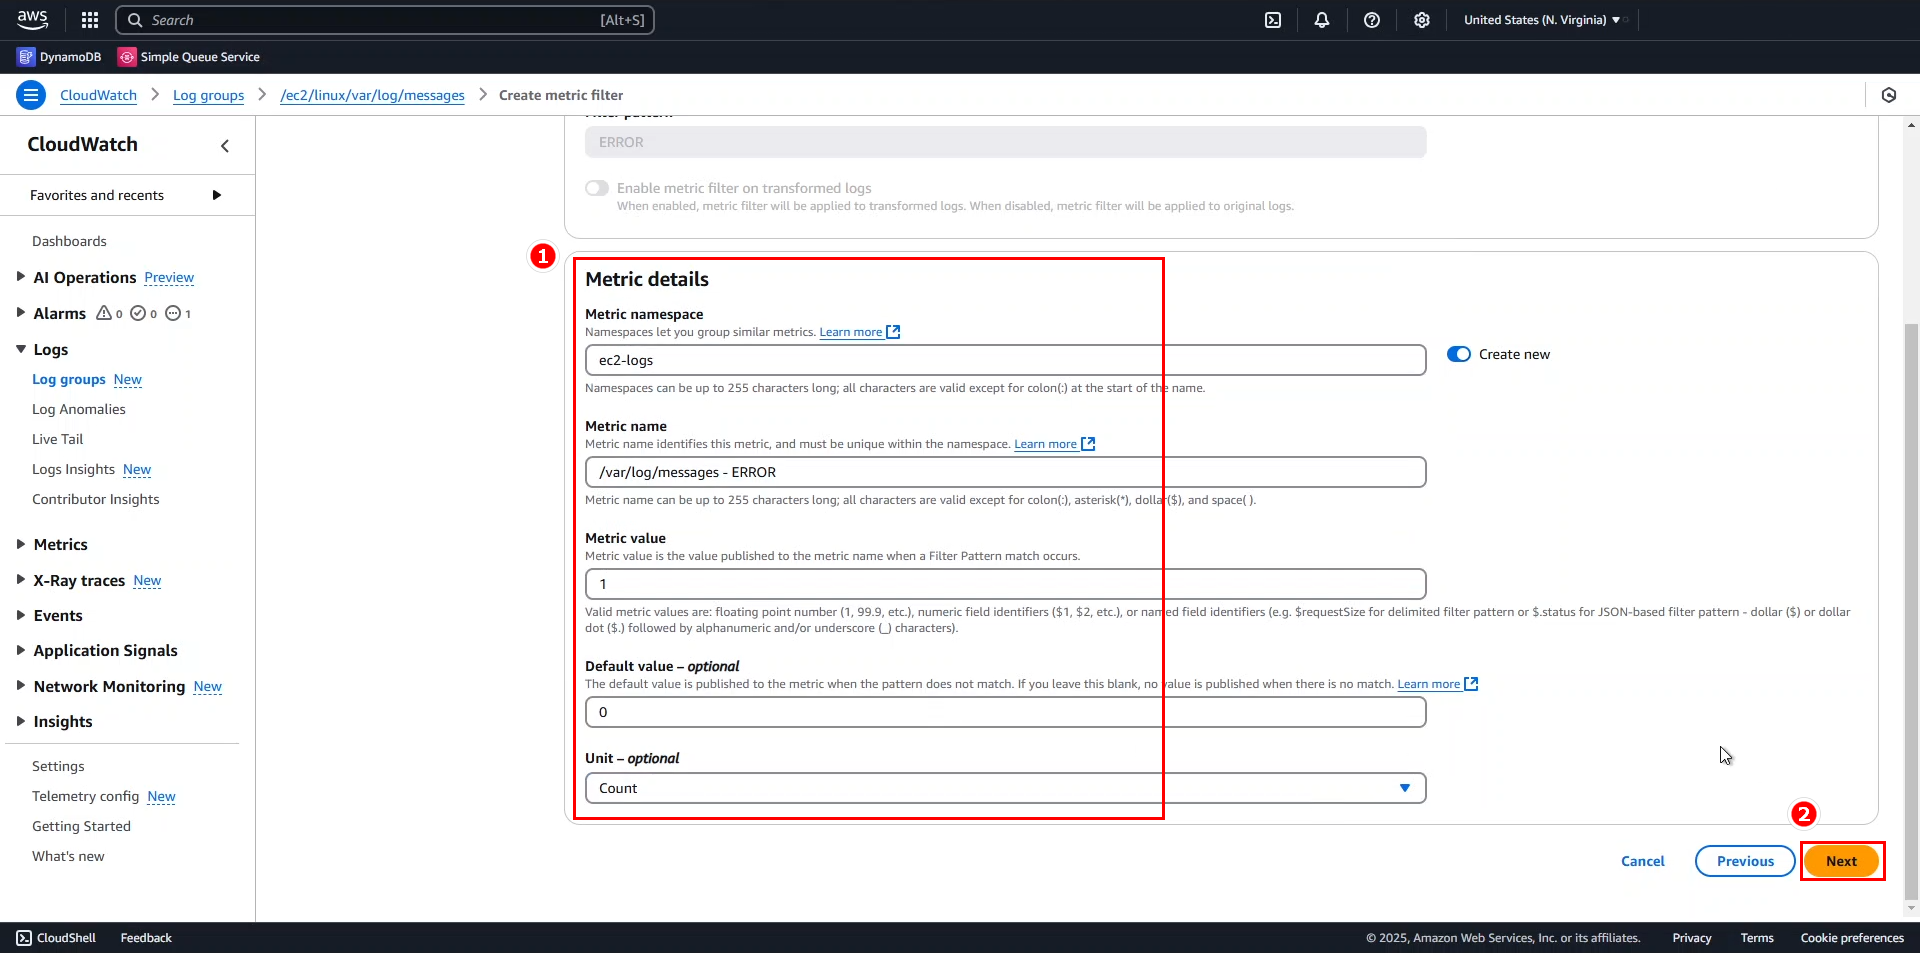
In the Metric details section, enter the following information:
- Metric namespace:
ec2-logs. - Metric name:
/var/log/messages - ERROR. - Metric value: 1.
- Default value: 0.
- Unit: select Count from the dropdown.
- Click Next.
- Metric namespace:
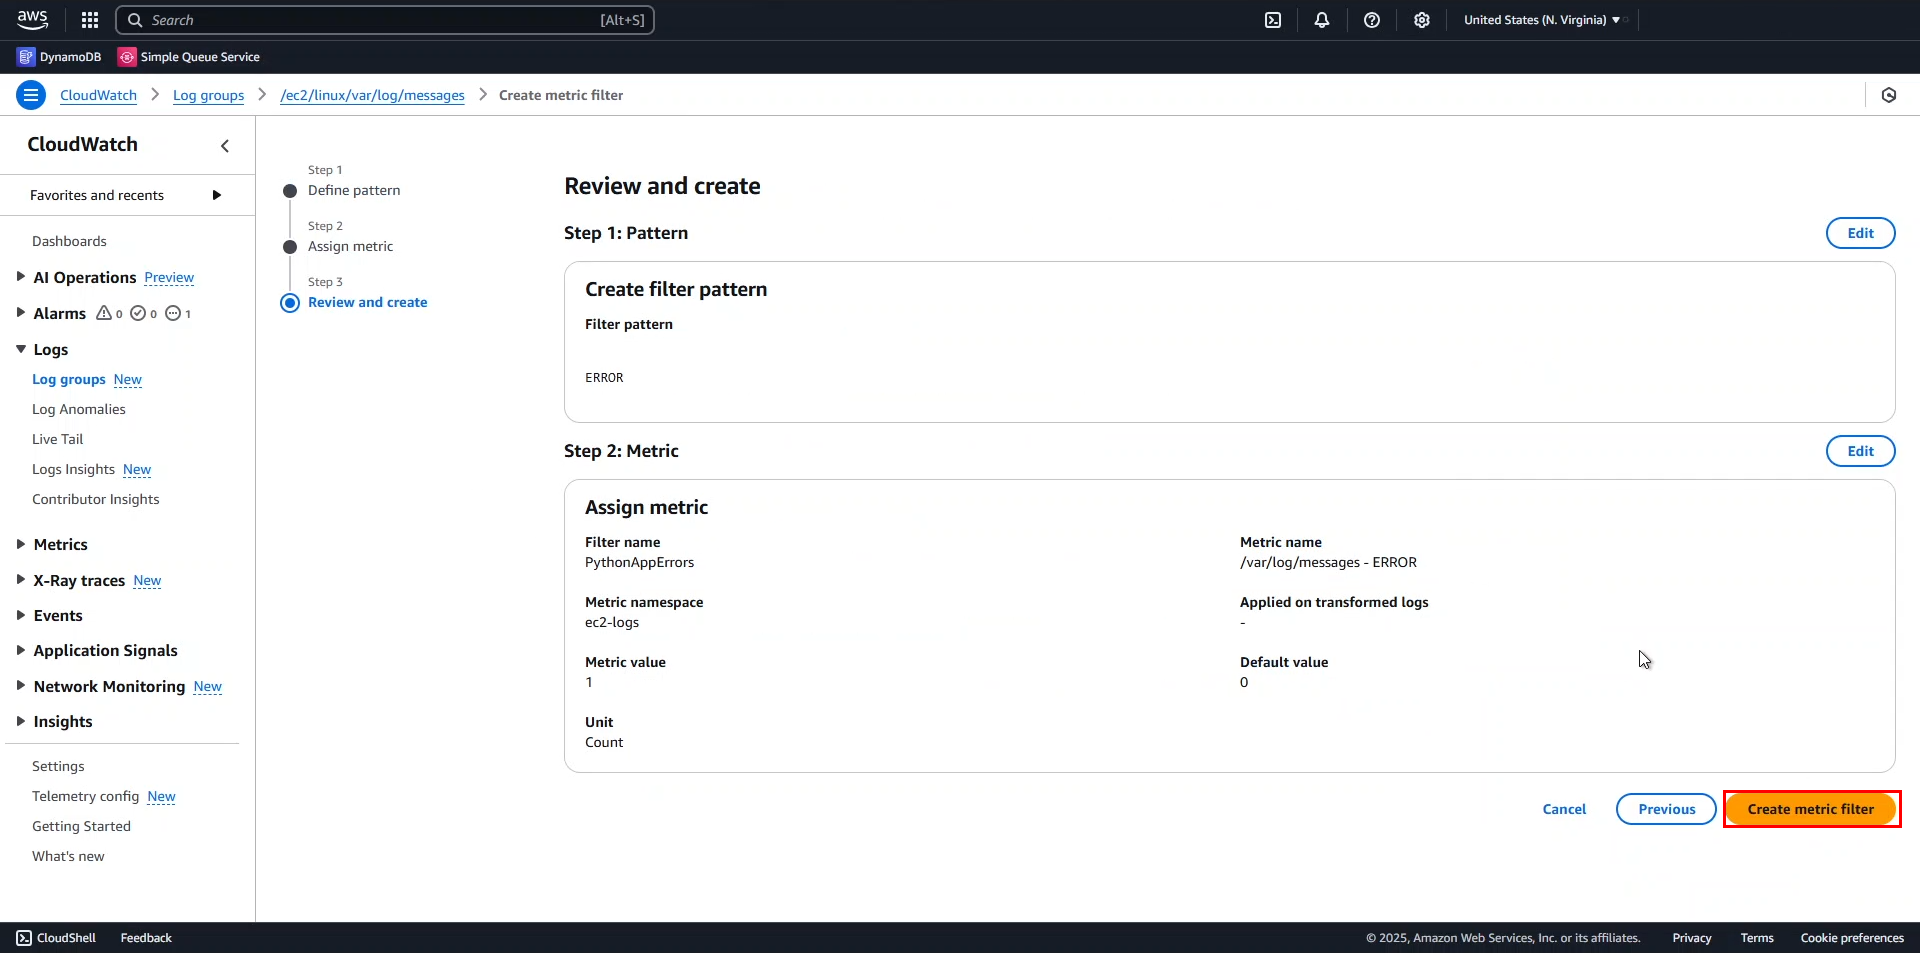
- After reviewing, click Create metric filter.
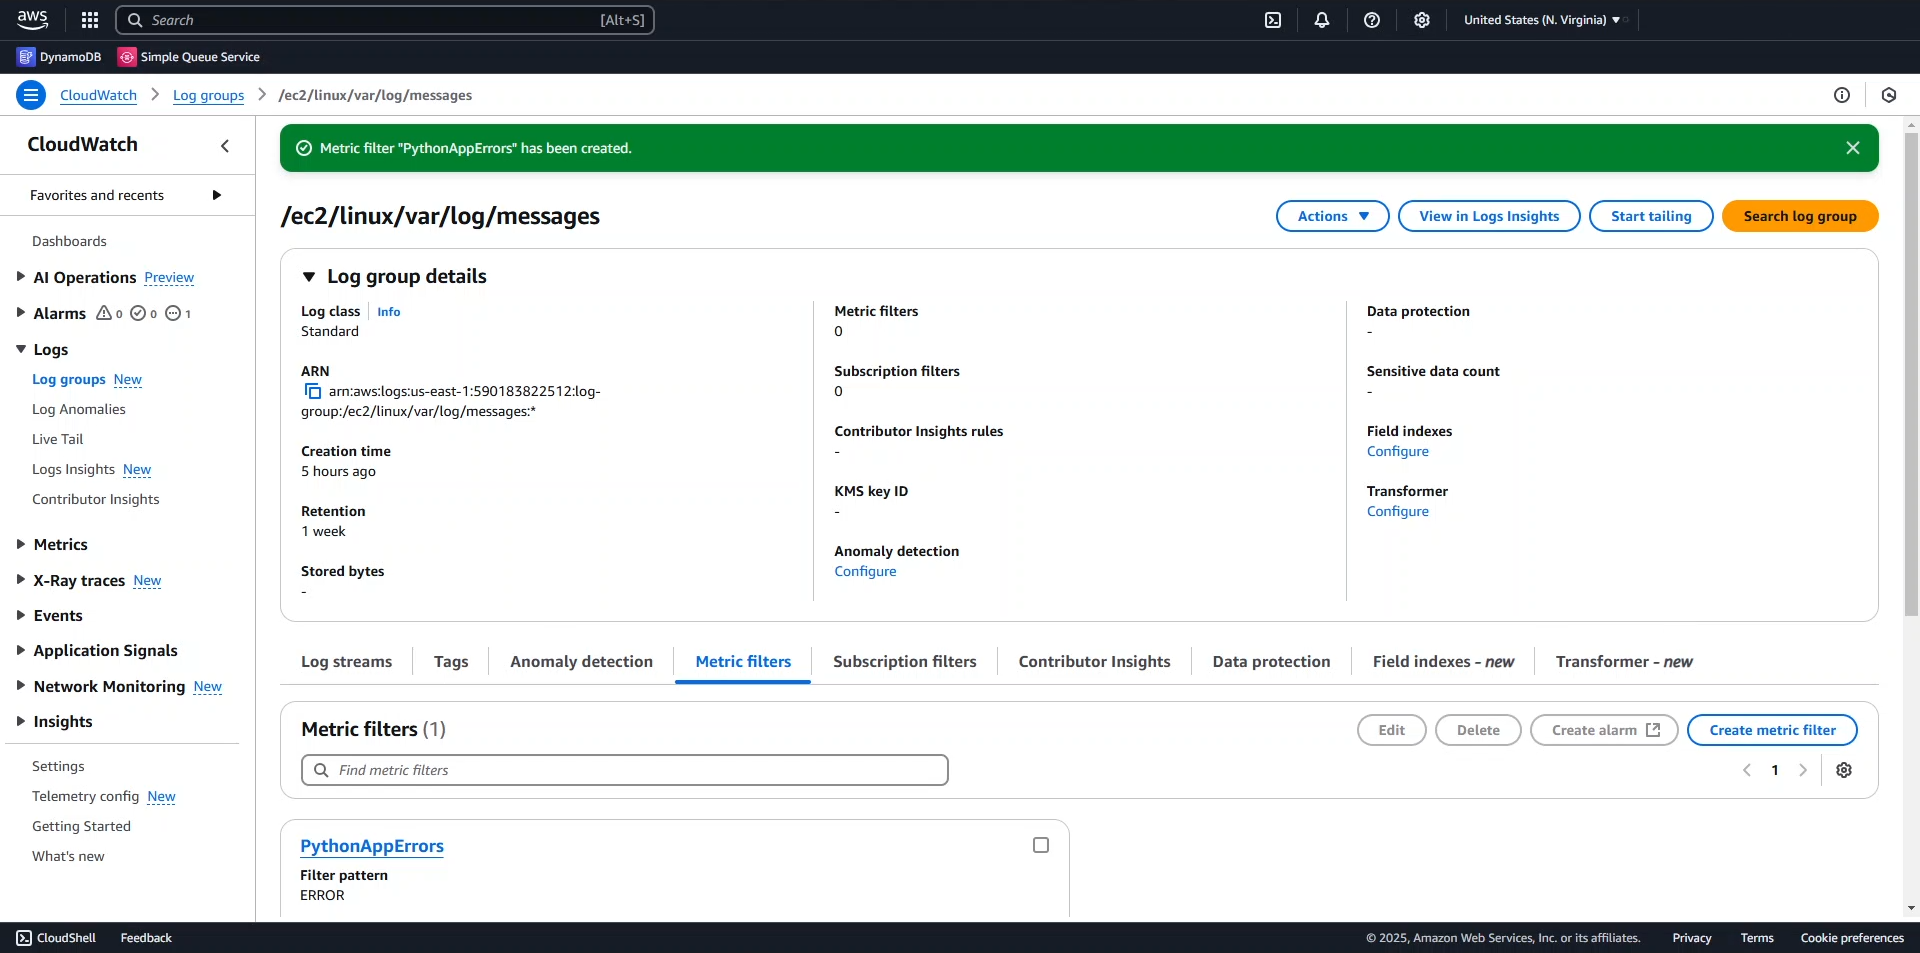
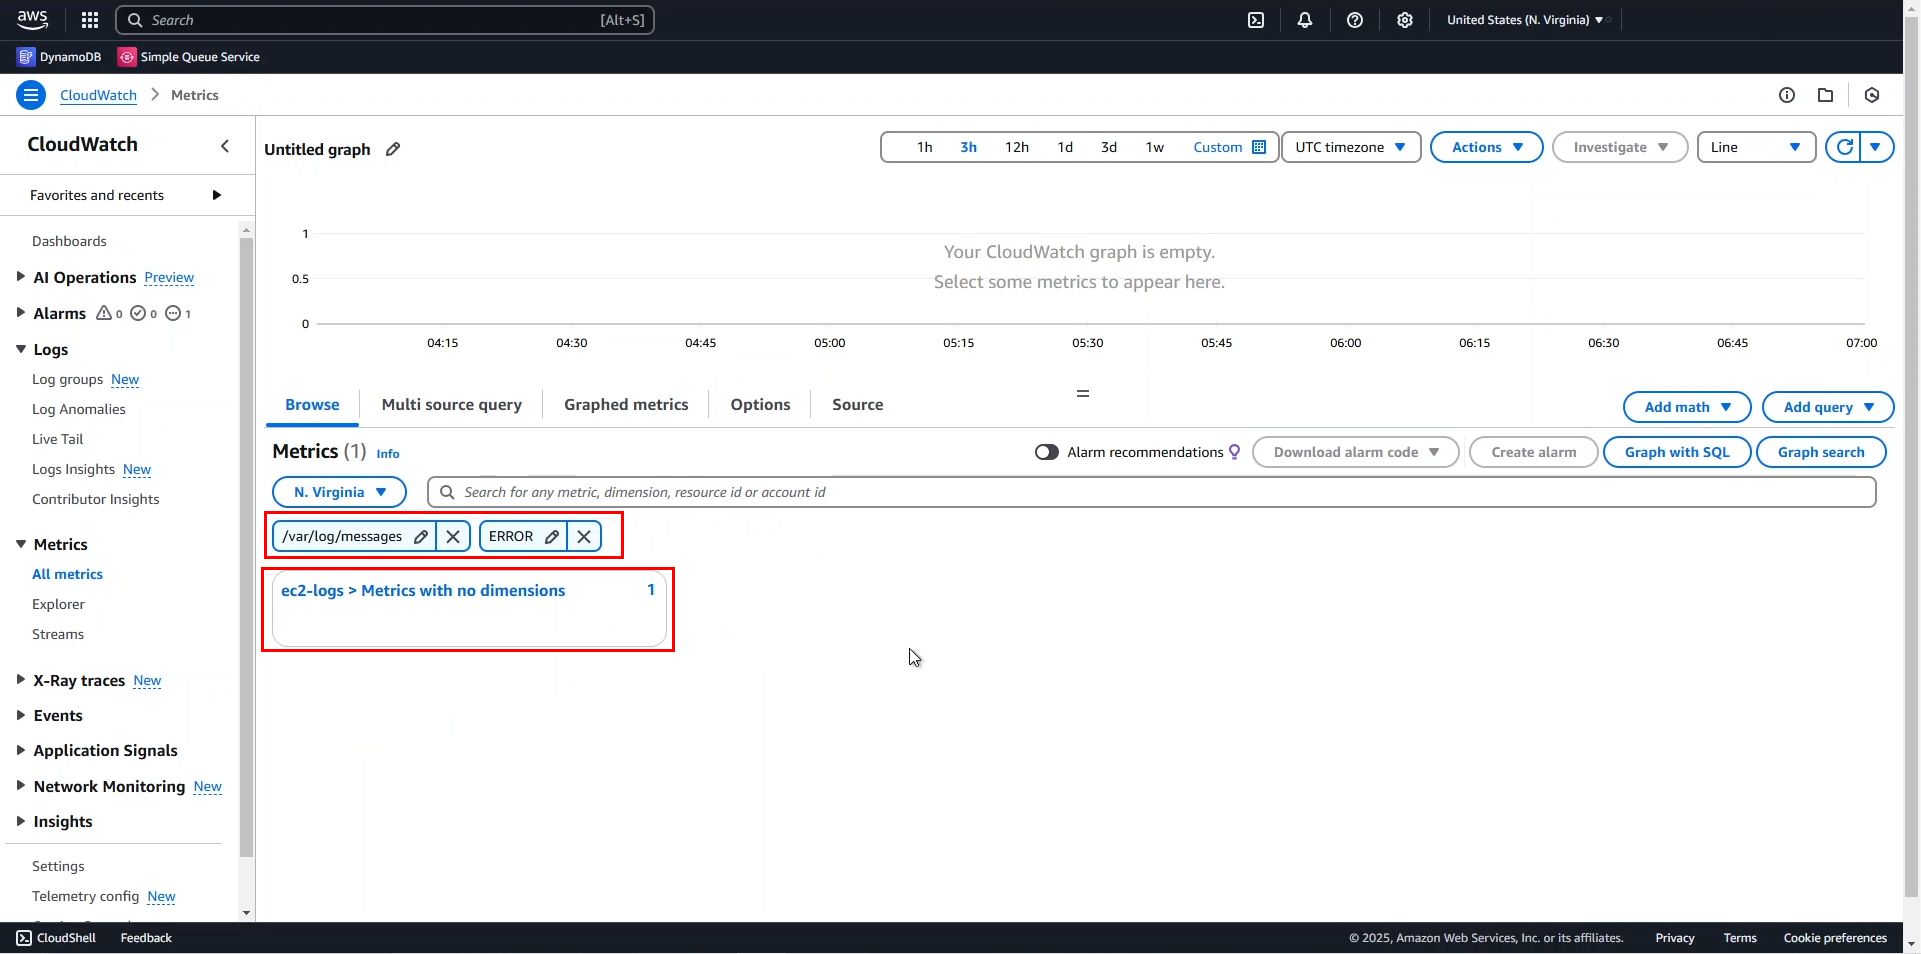
Go back to Metrics > All metrics.
- Search for the keywords
/var/log/messagesandERROR. - Select ec2-logs > Metrics with no dimensions.
- Search for the keywords
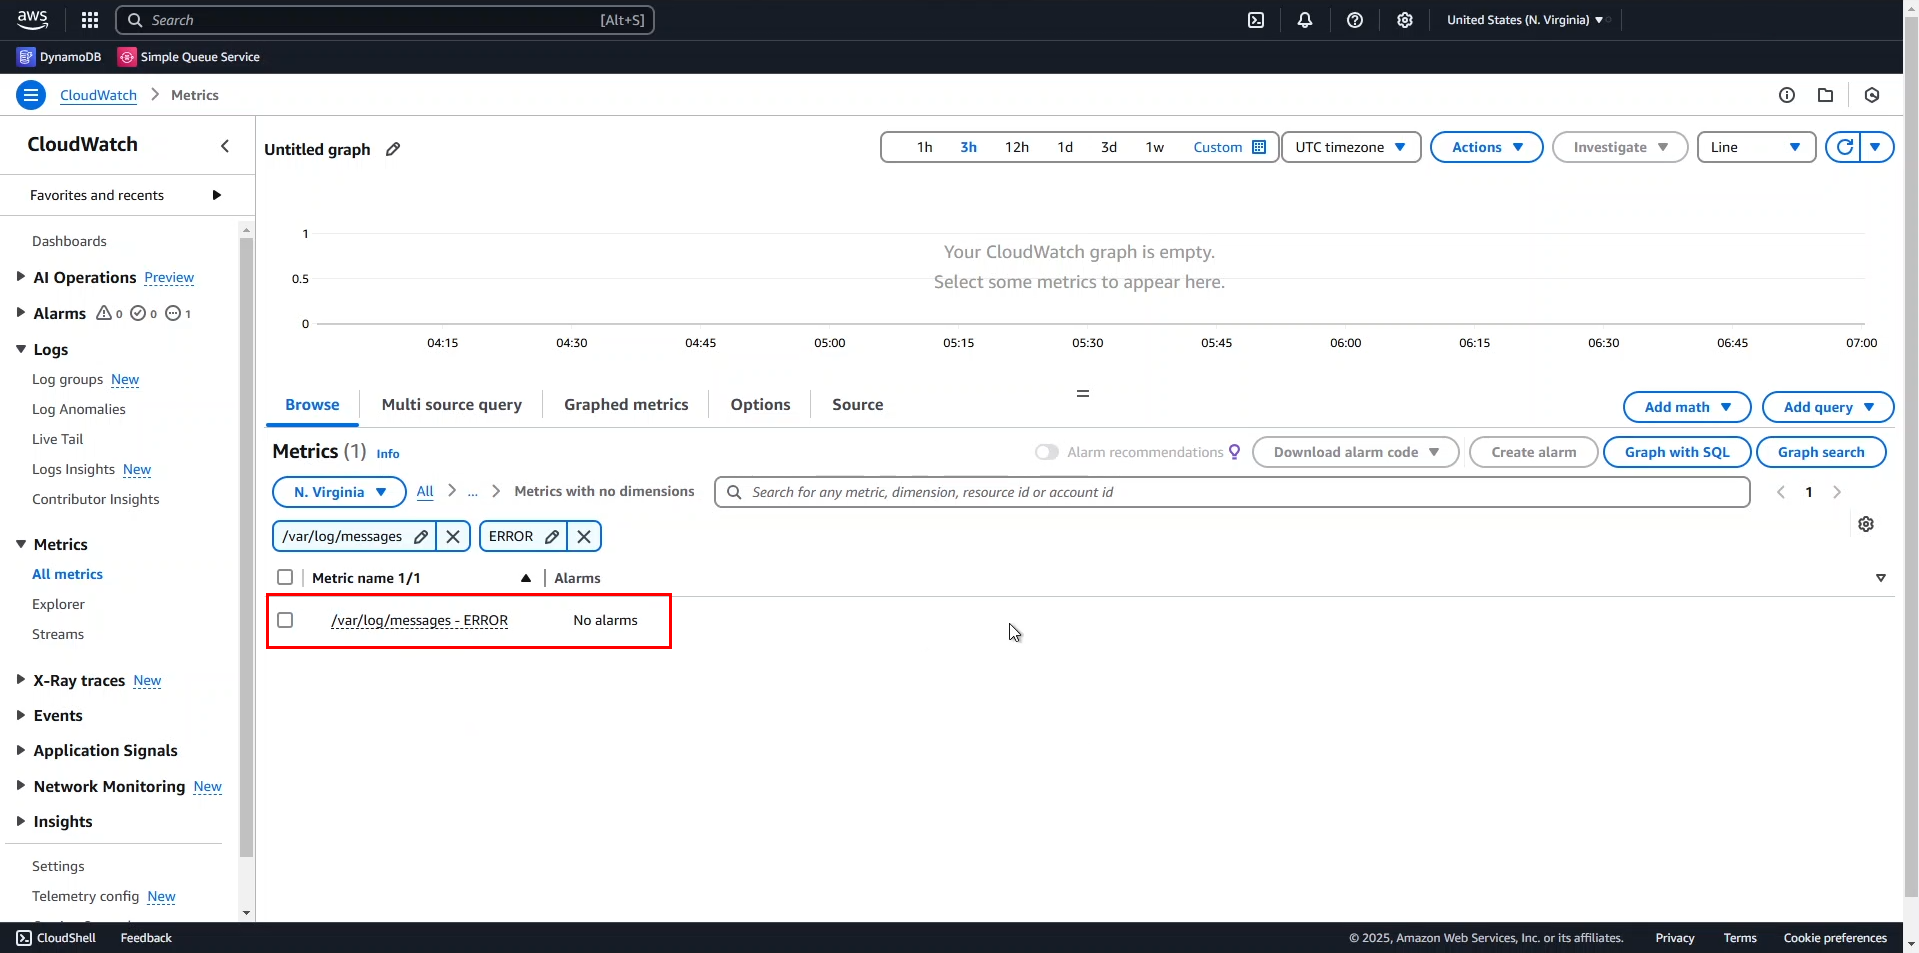
Now we have a metric that retrieves ERROR logs from the application. In the next step, we will set up an alarm for this metric.