Search expressions
Search Expressions
In the previous section, we manually viewed metrics, but this method has limitations and requires multiple interactions with different metrics. In this section, we can perform this more efficiently using Search Expressions.
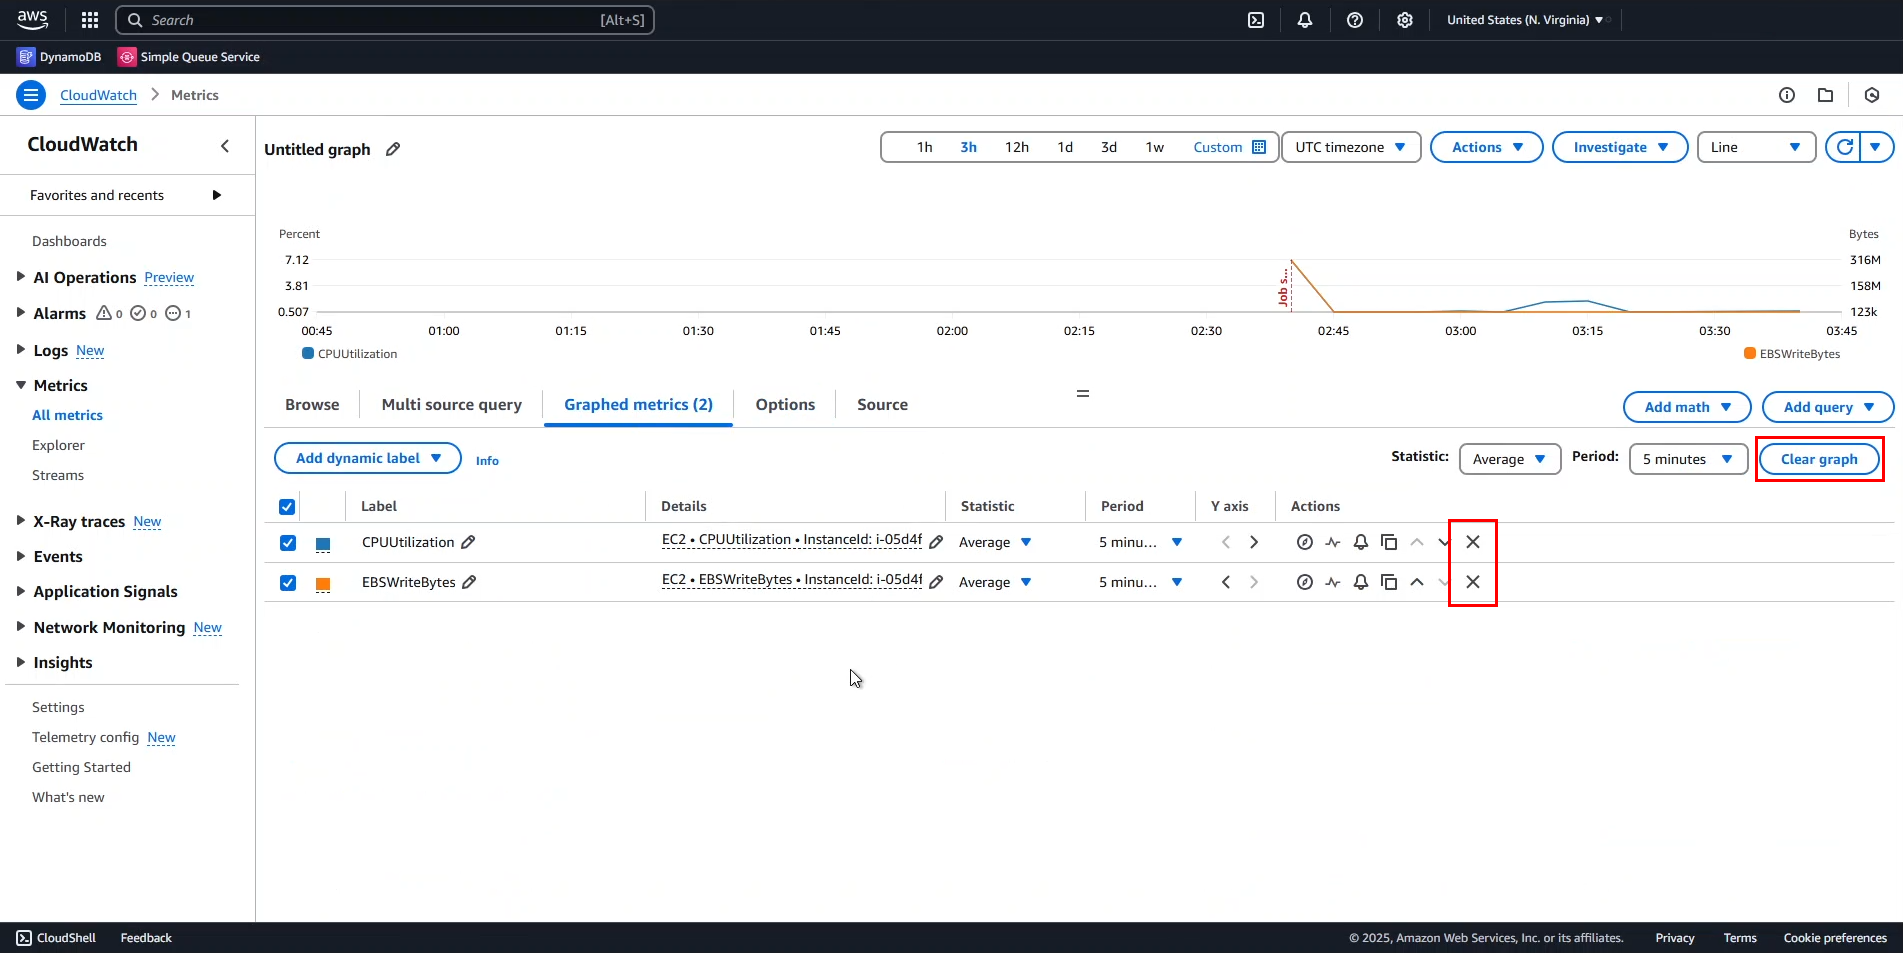
- Remove all information from the old graph by clicking X or Clear graph.
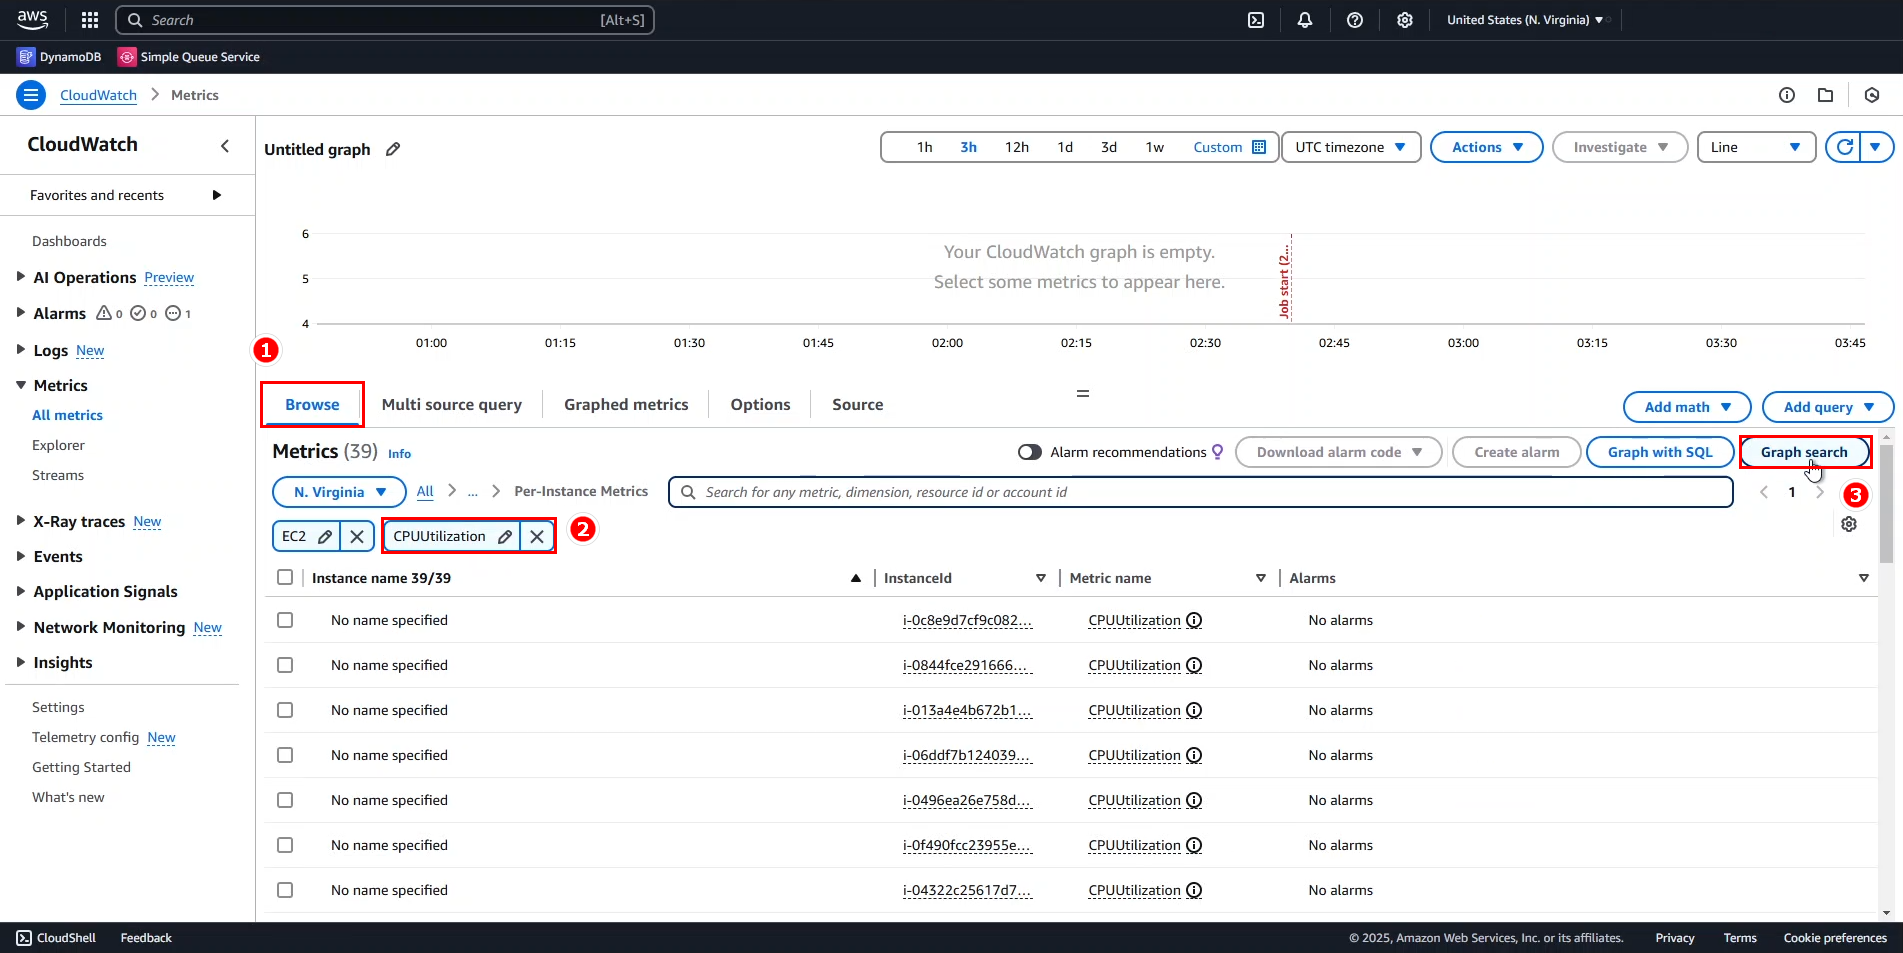
Return to the Browse tab
- Remove the EBSWriteBytes filter.
- Add CPUUtilization.
- Click Graph search.
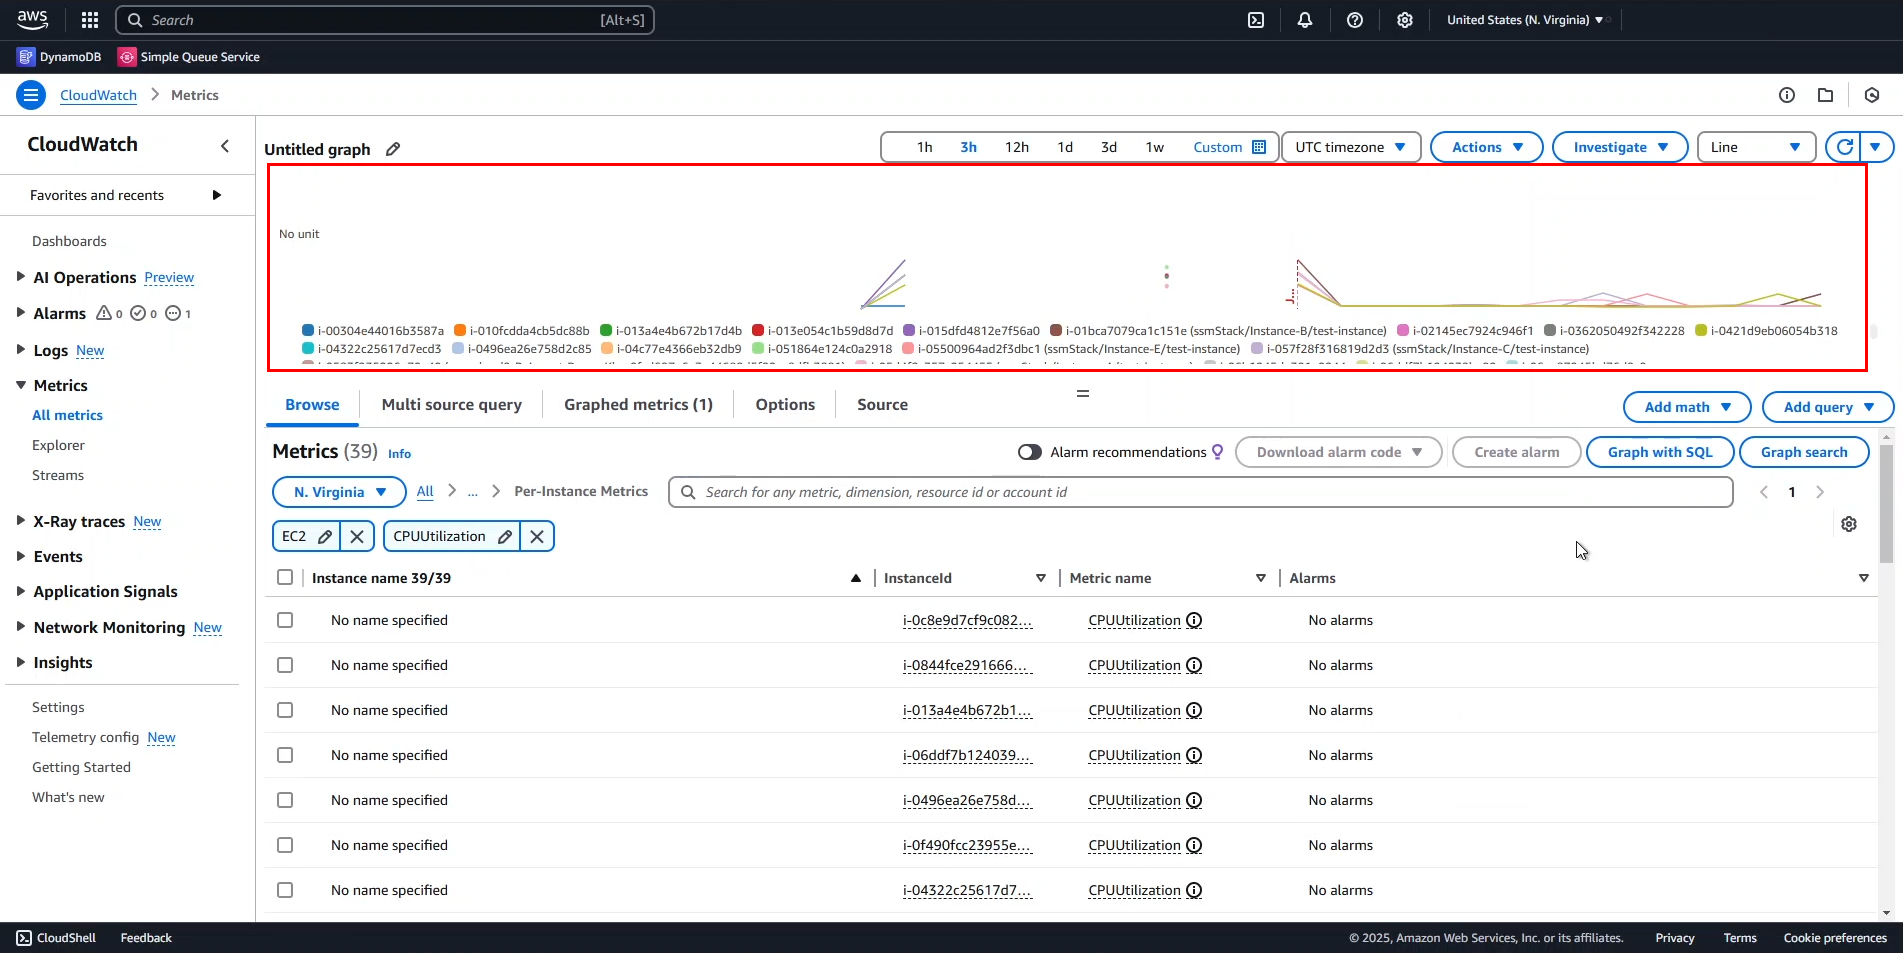
- Go back to the Graphed metrics tab, where a new search expression has appeared in the Details column.
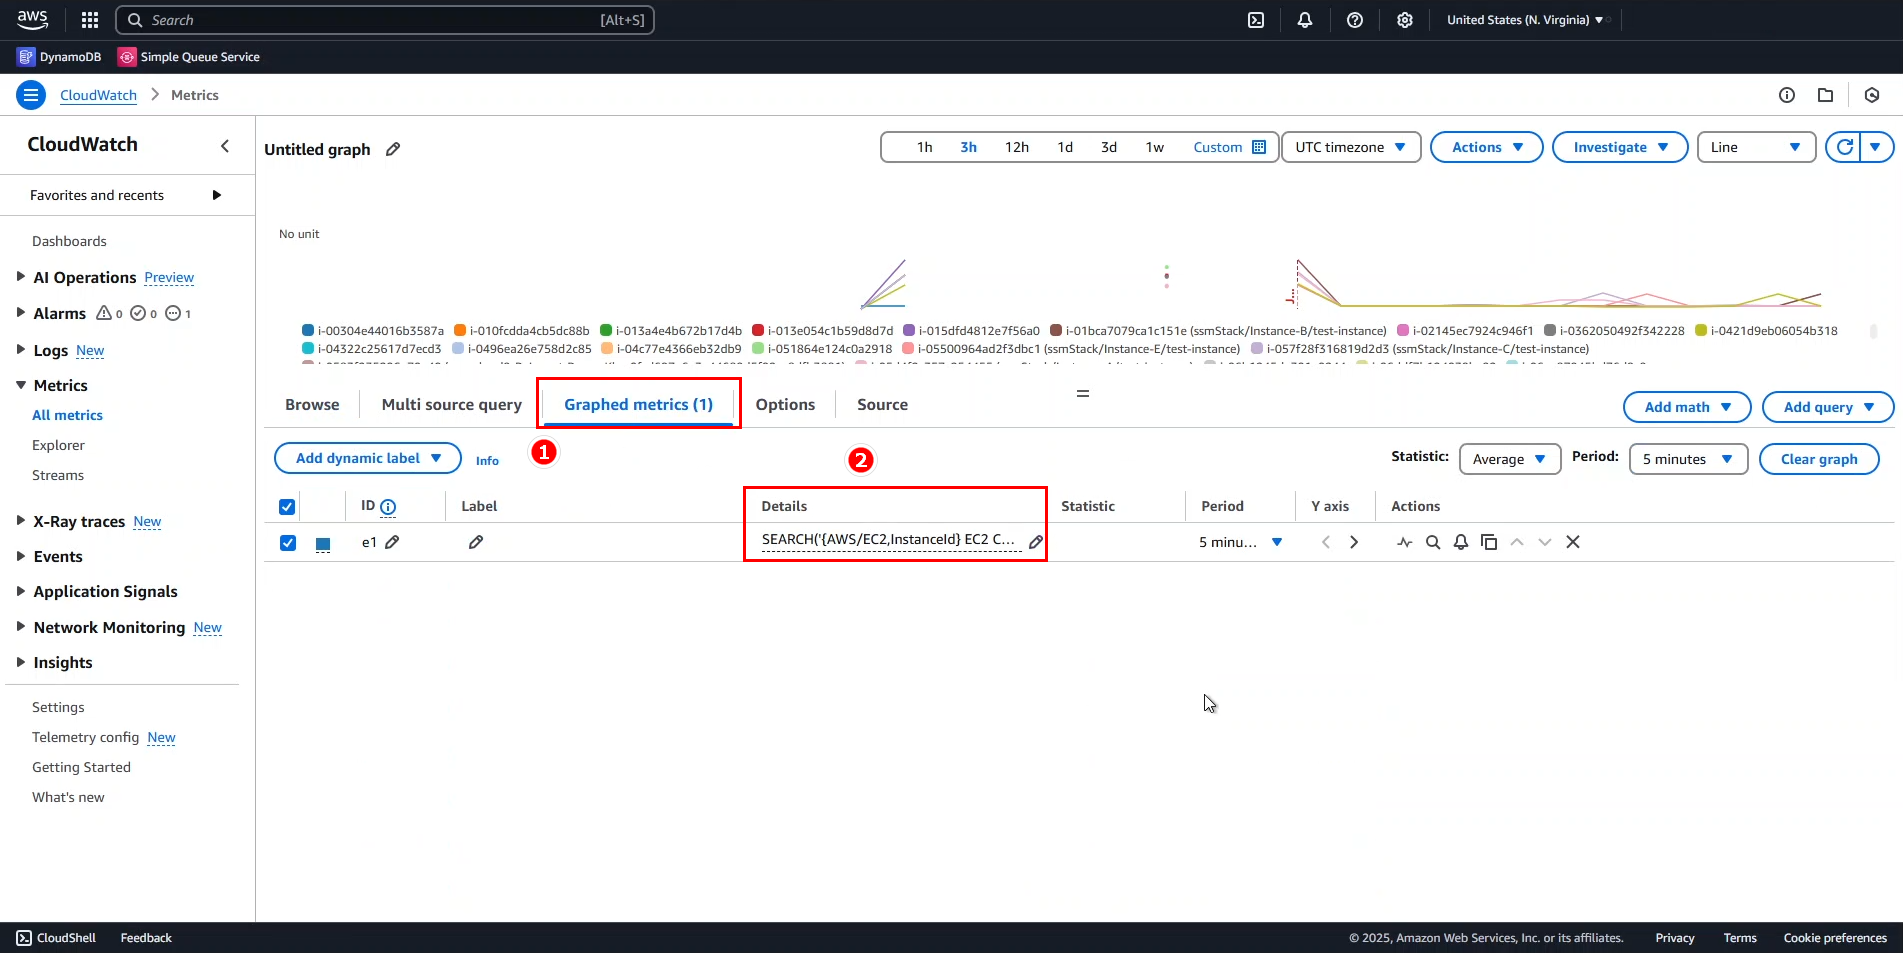
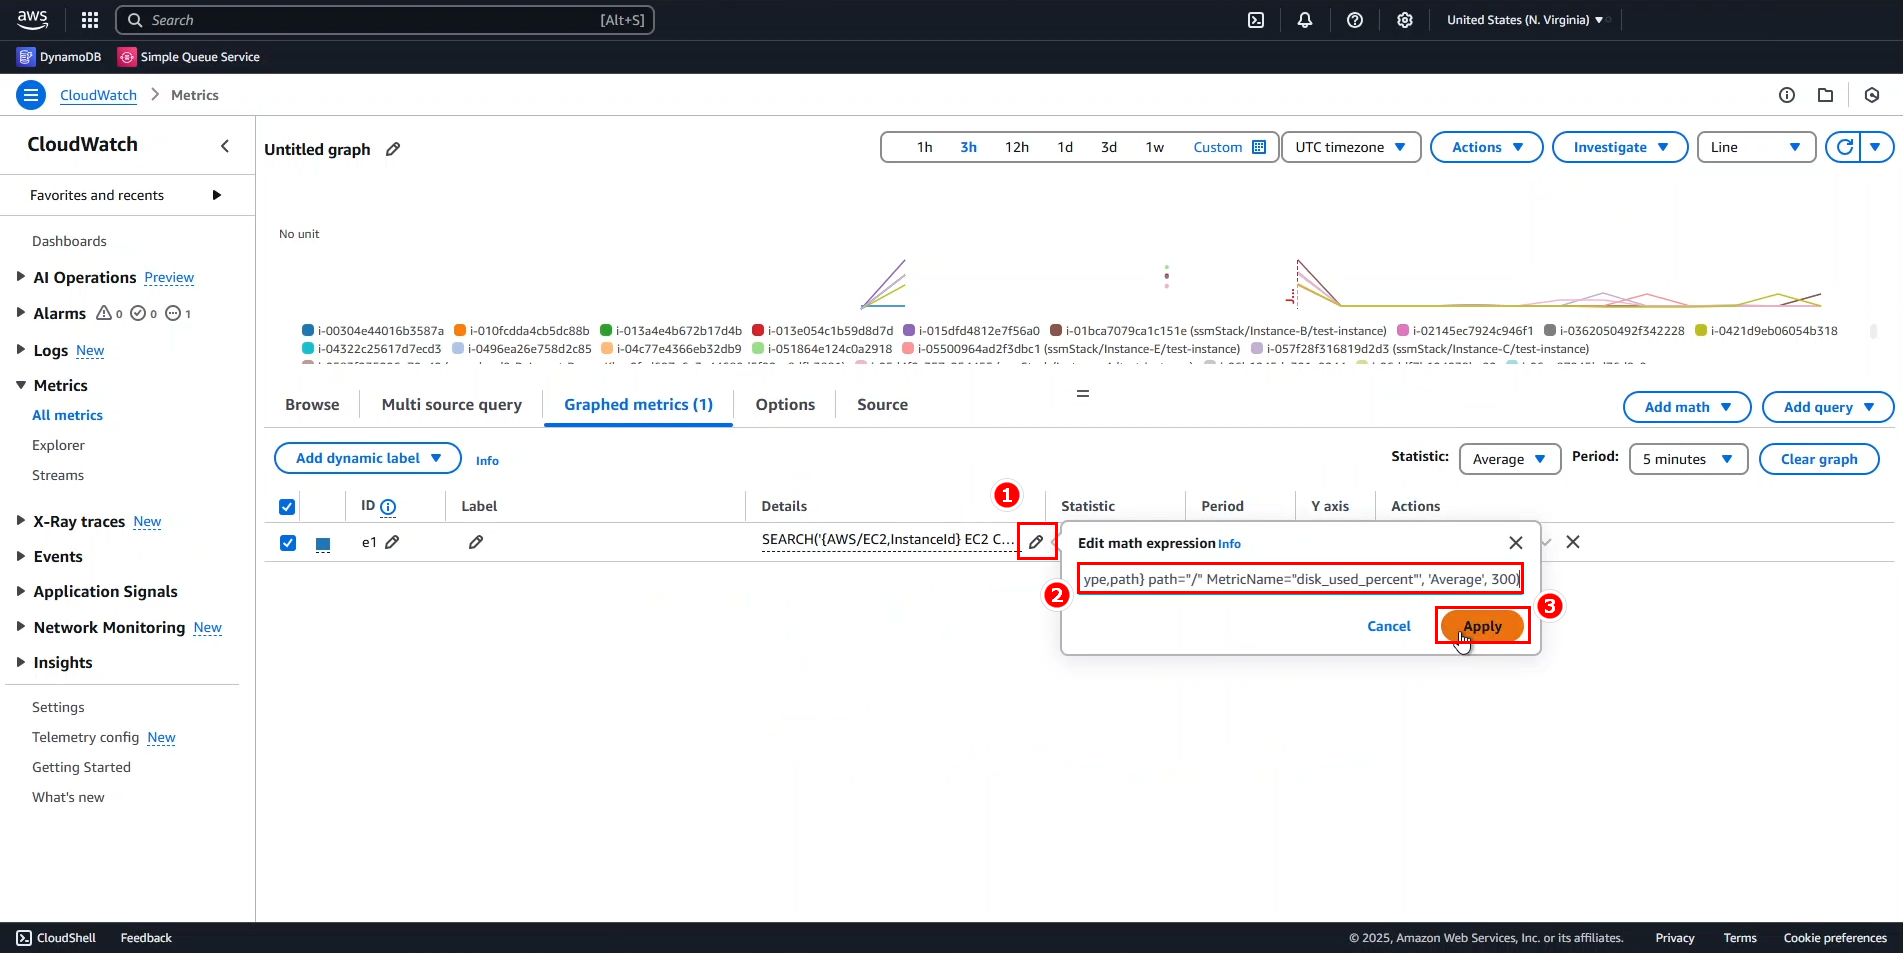
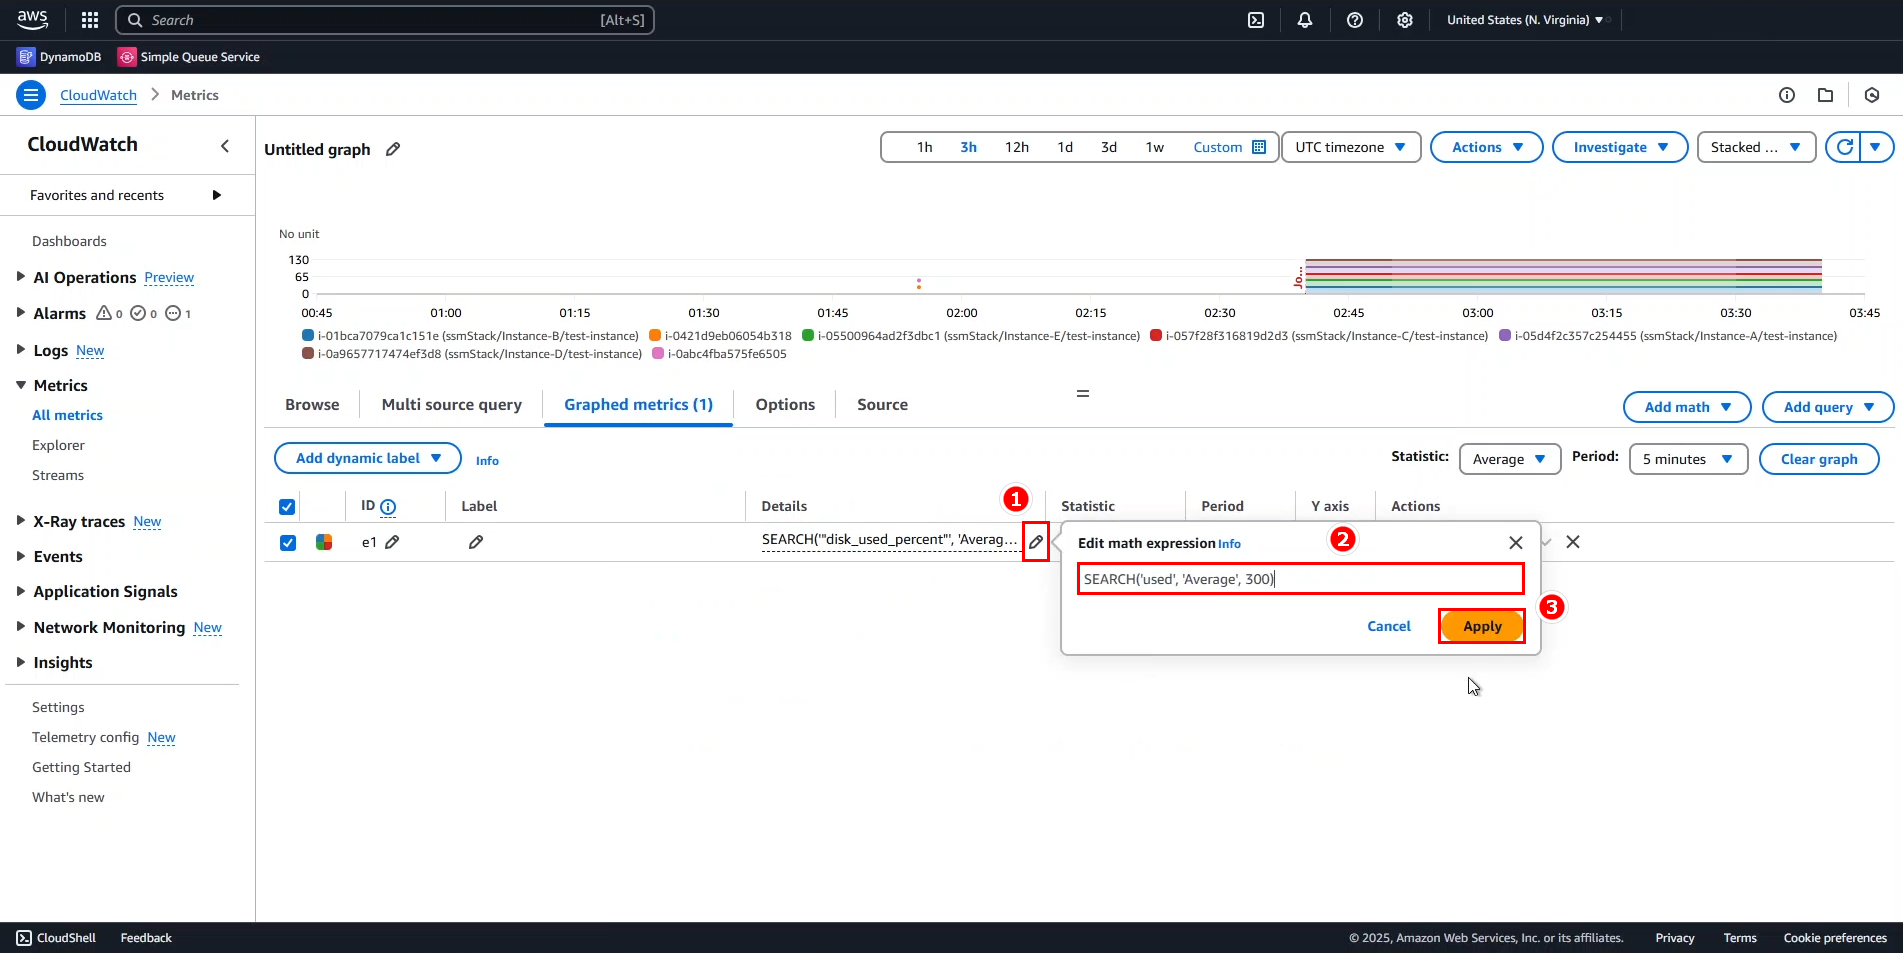
- Enter a new expression as shown below. This expression searches in a different Namespace outside EC2.
Then, click Apply to apply the changes.
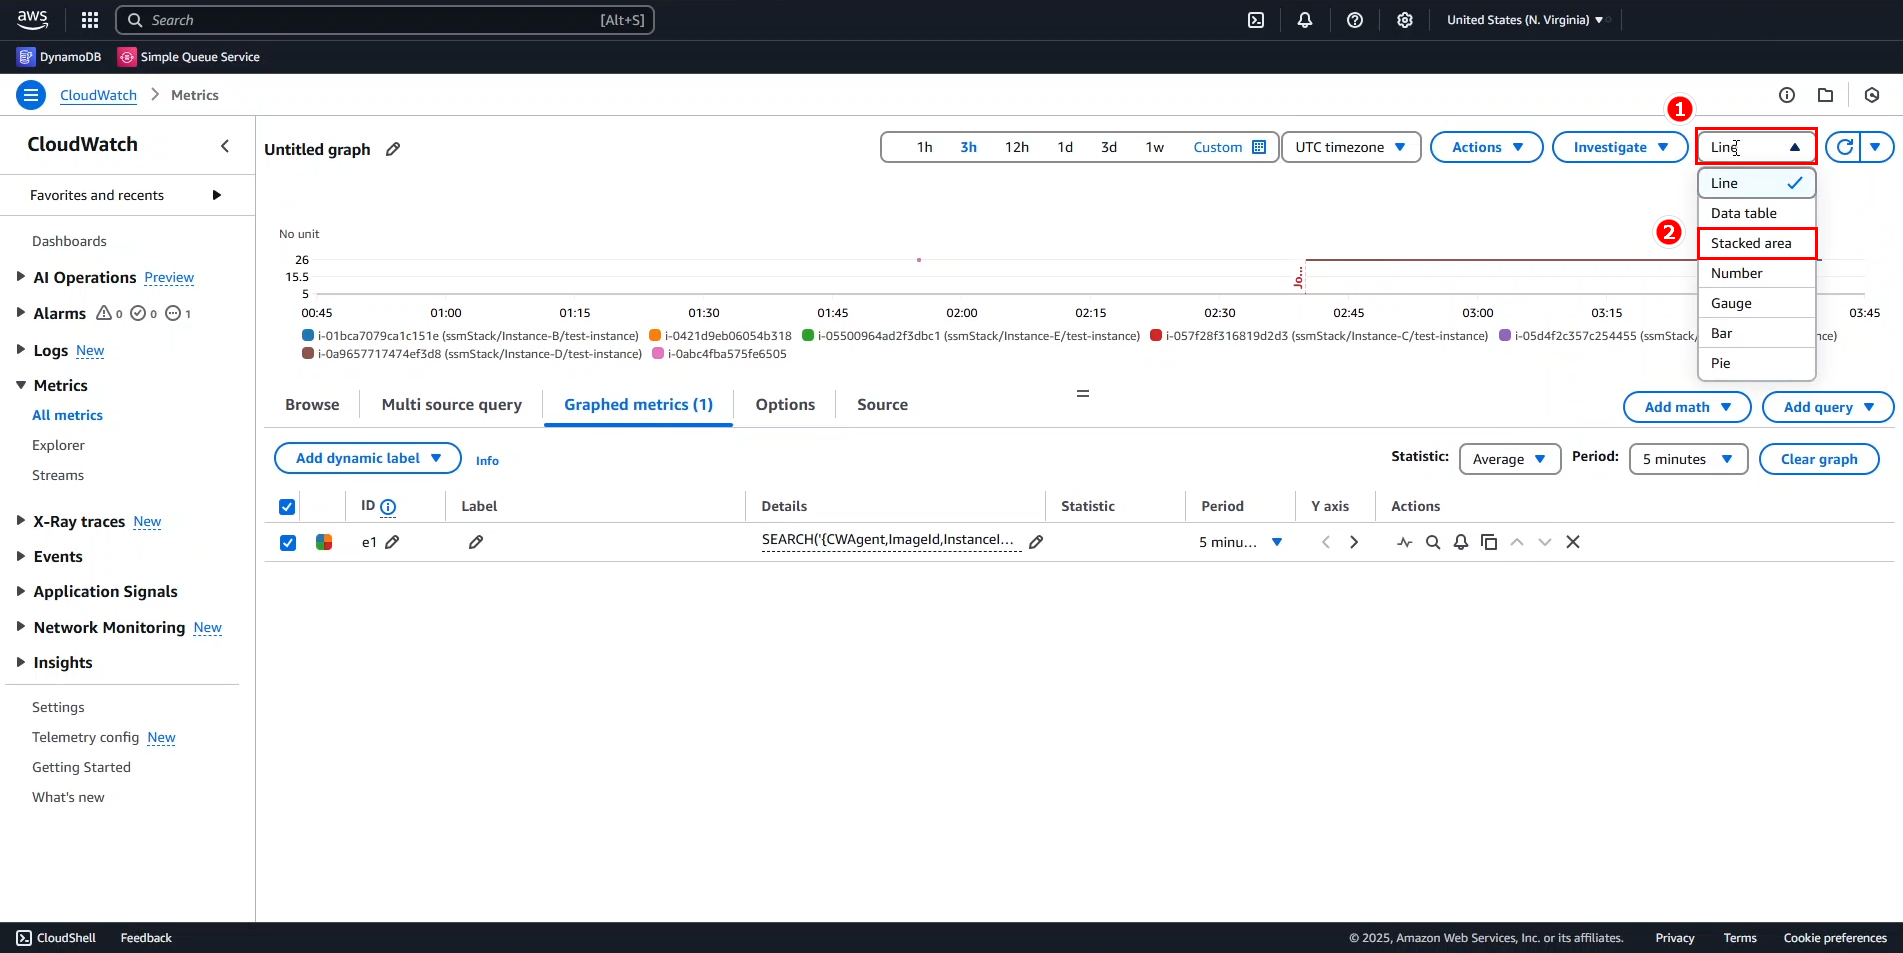
In the upper-right corner
- Open the Line dropdown.
- Select Stacked area.
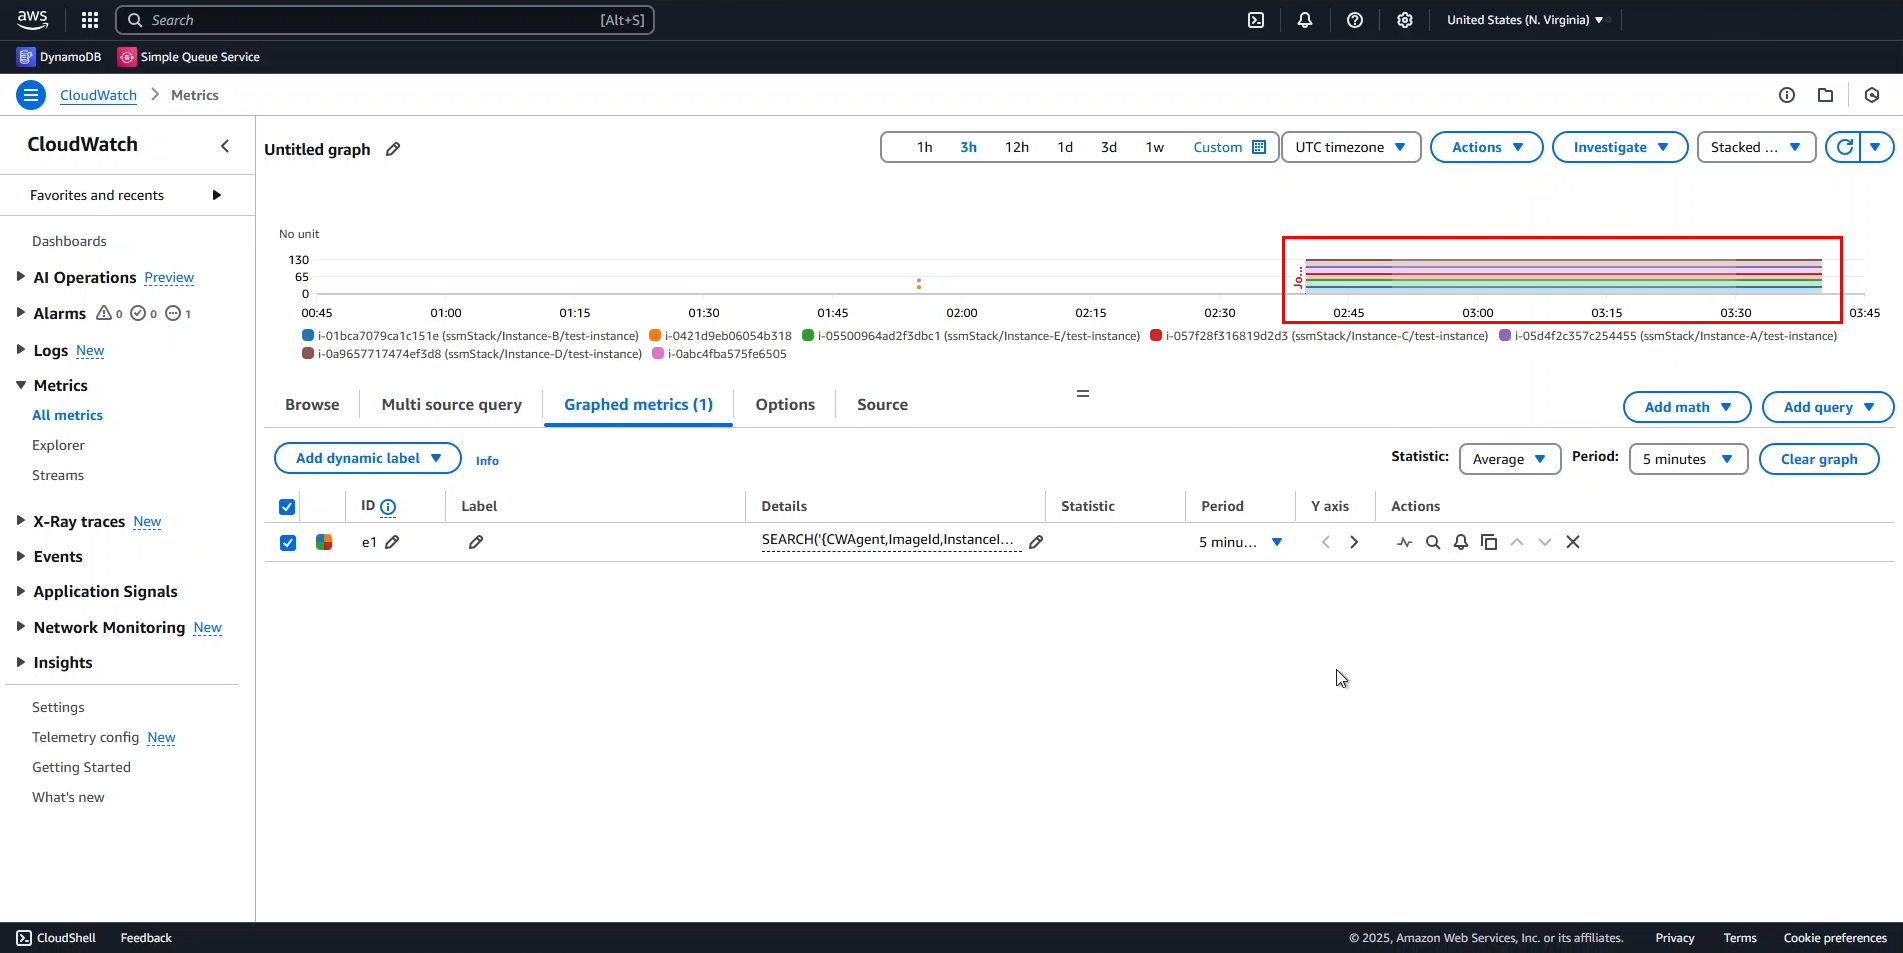
Now, the graph is easier to read.
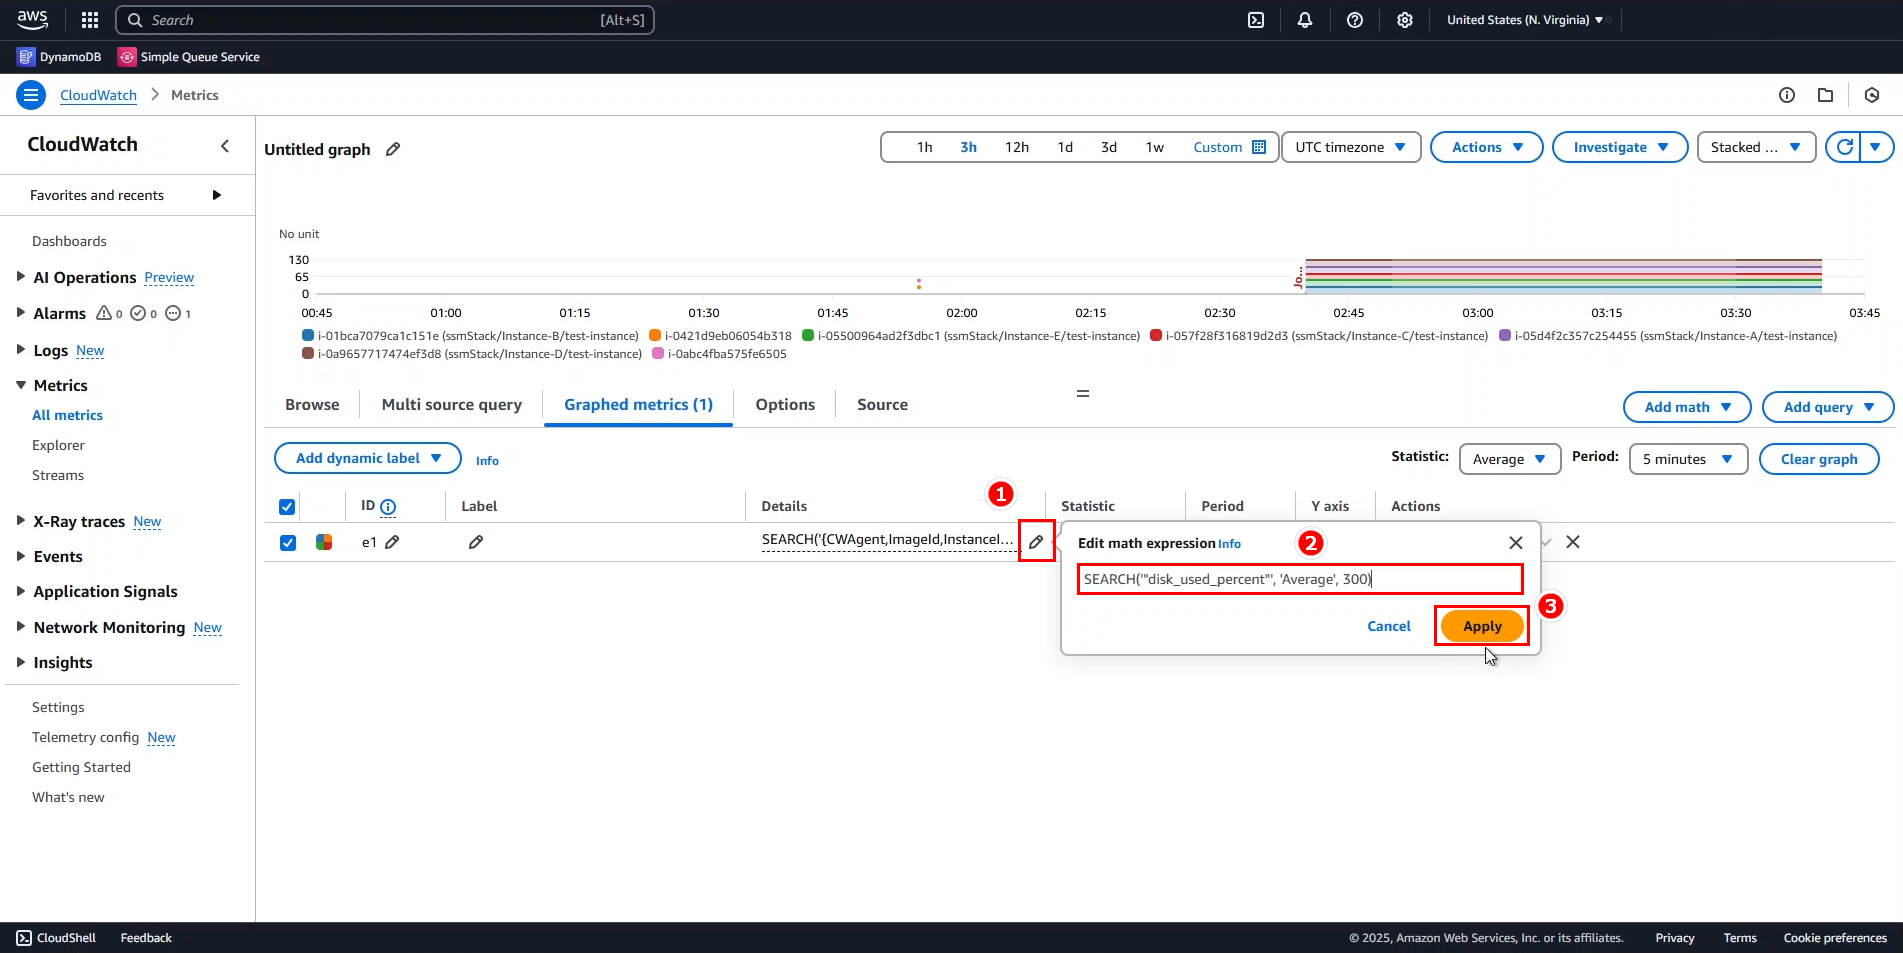
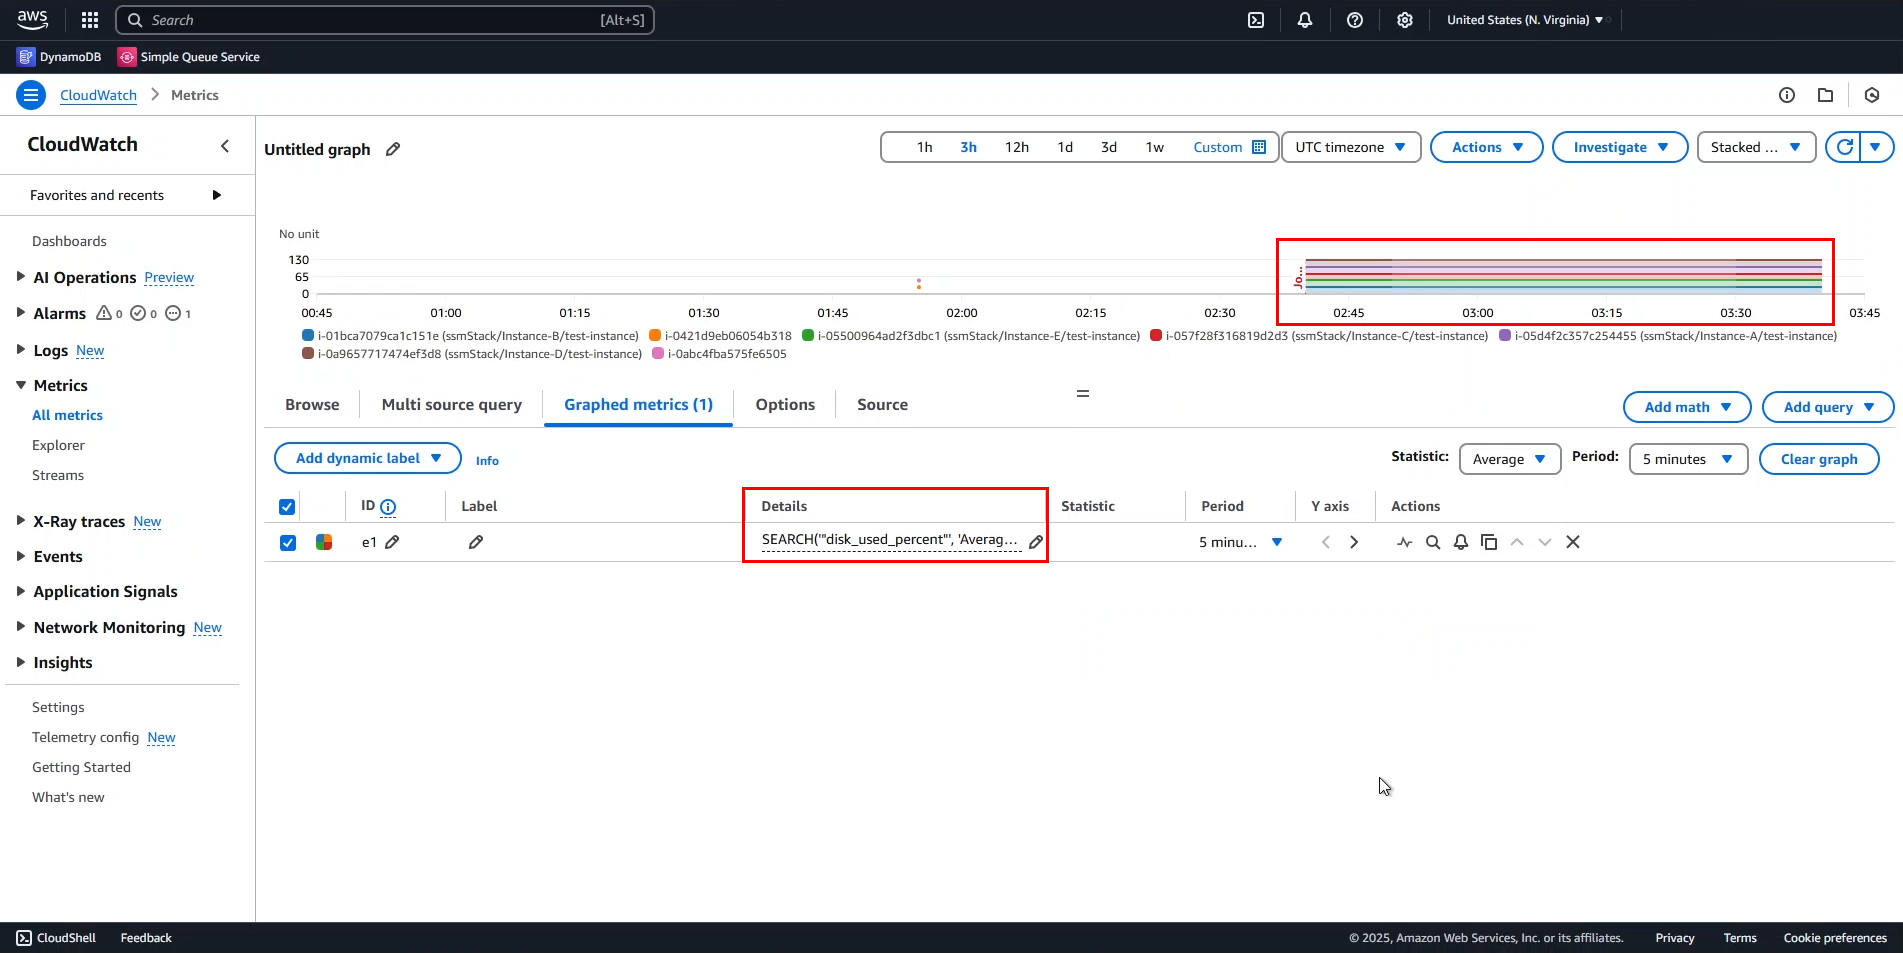
- Search for the average memory usage percentage (Disk Used Percent)
SEARCH("disk_used_percent", 'Average', 300)
- Search using the keyword “used”
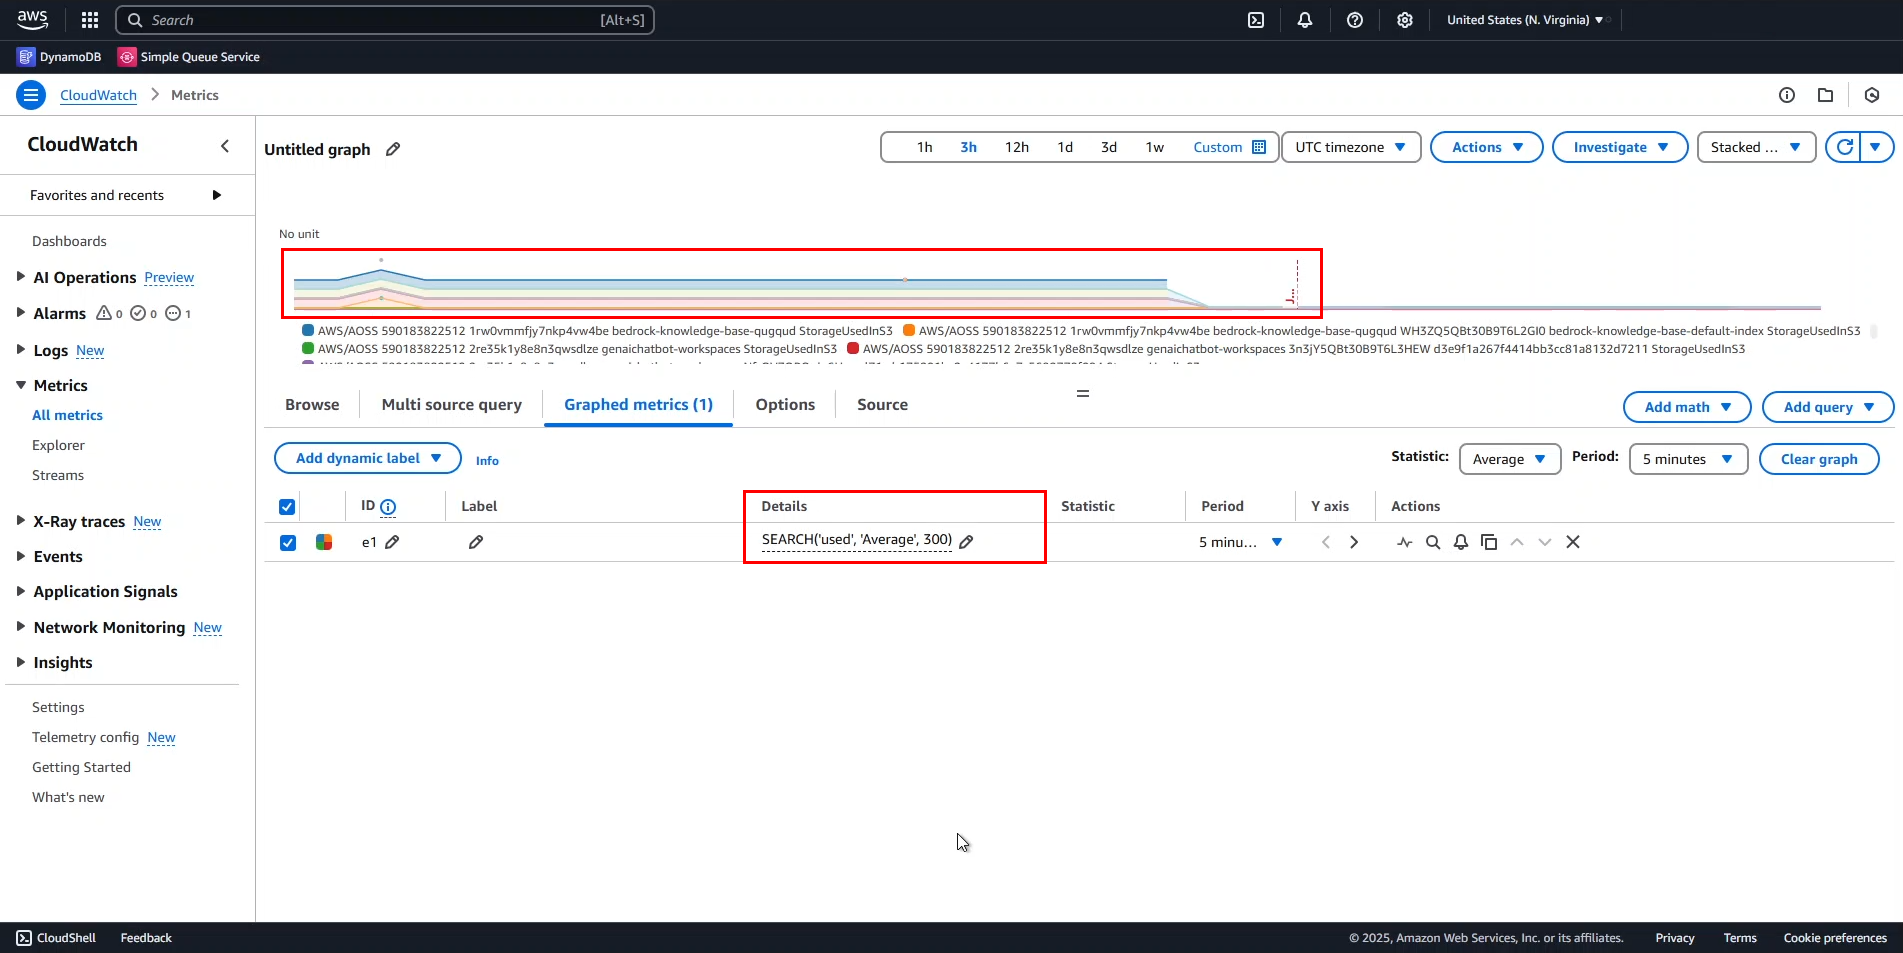
SEARCH("used", 'Average', 300)
The results have changed slightly.
Okay, so we have completed the basic search operations in CloudWatch Console. In the next section, we will perform simple calculations.