Viewing Metrics
Viewing Metrics
First, we will practice viewing metrics.
- Access AWS Management Console
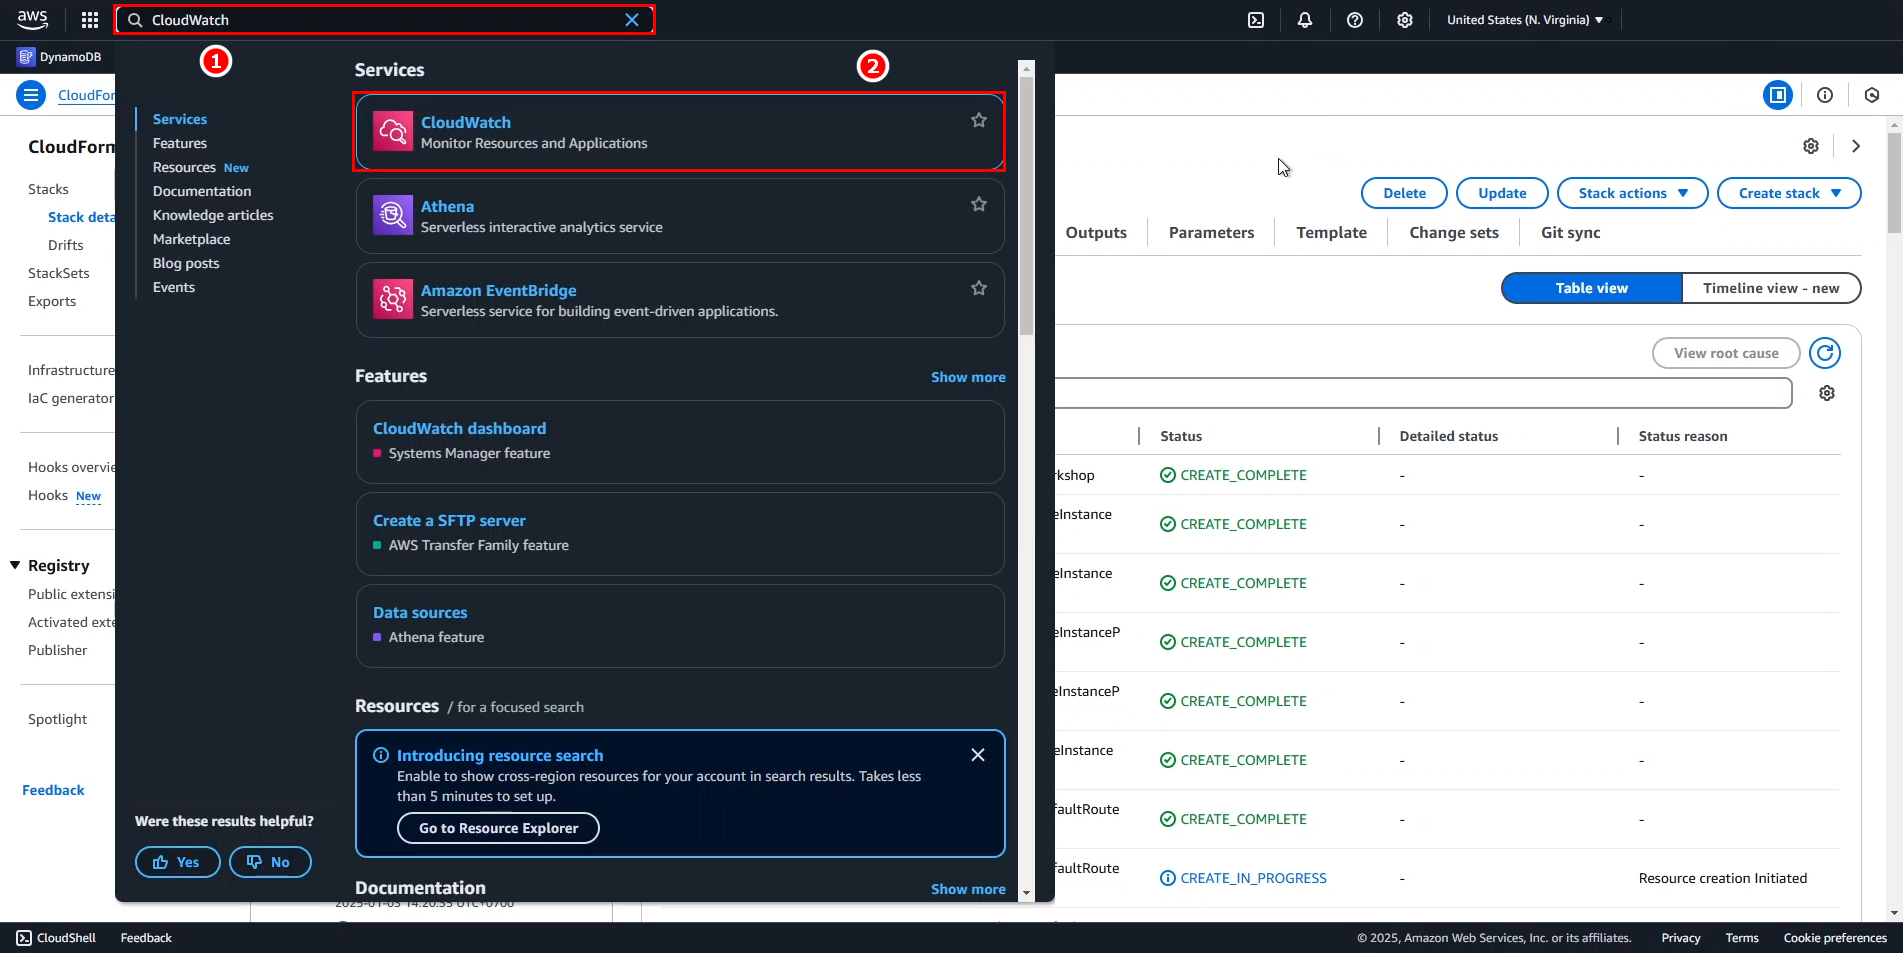
- Search for CloudWatch
- Select CloudWatch
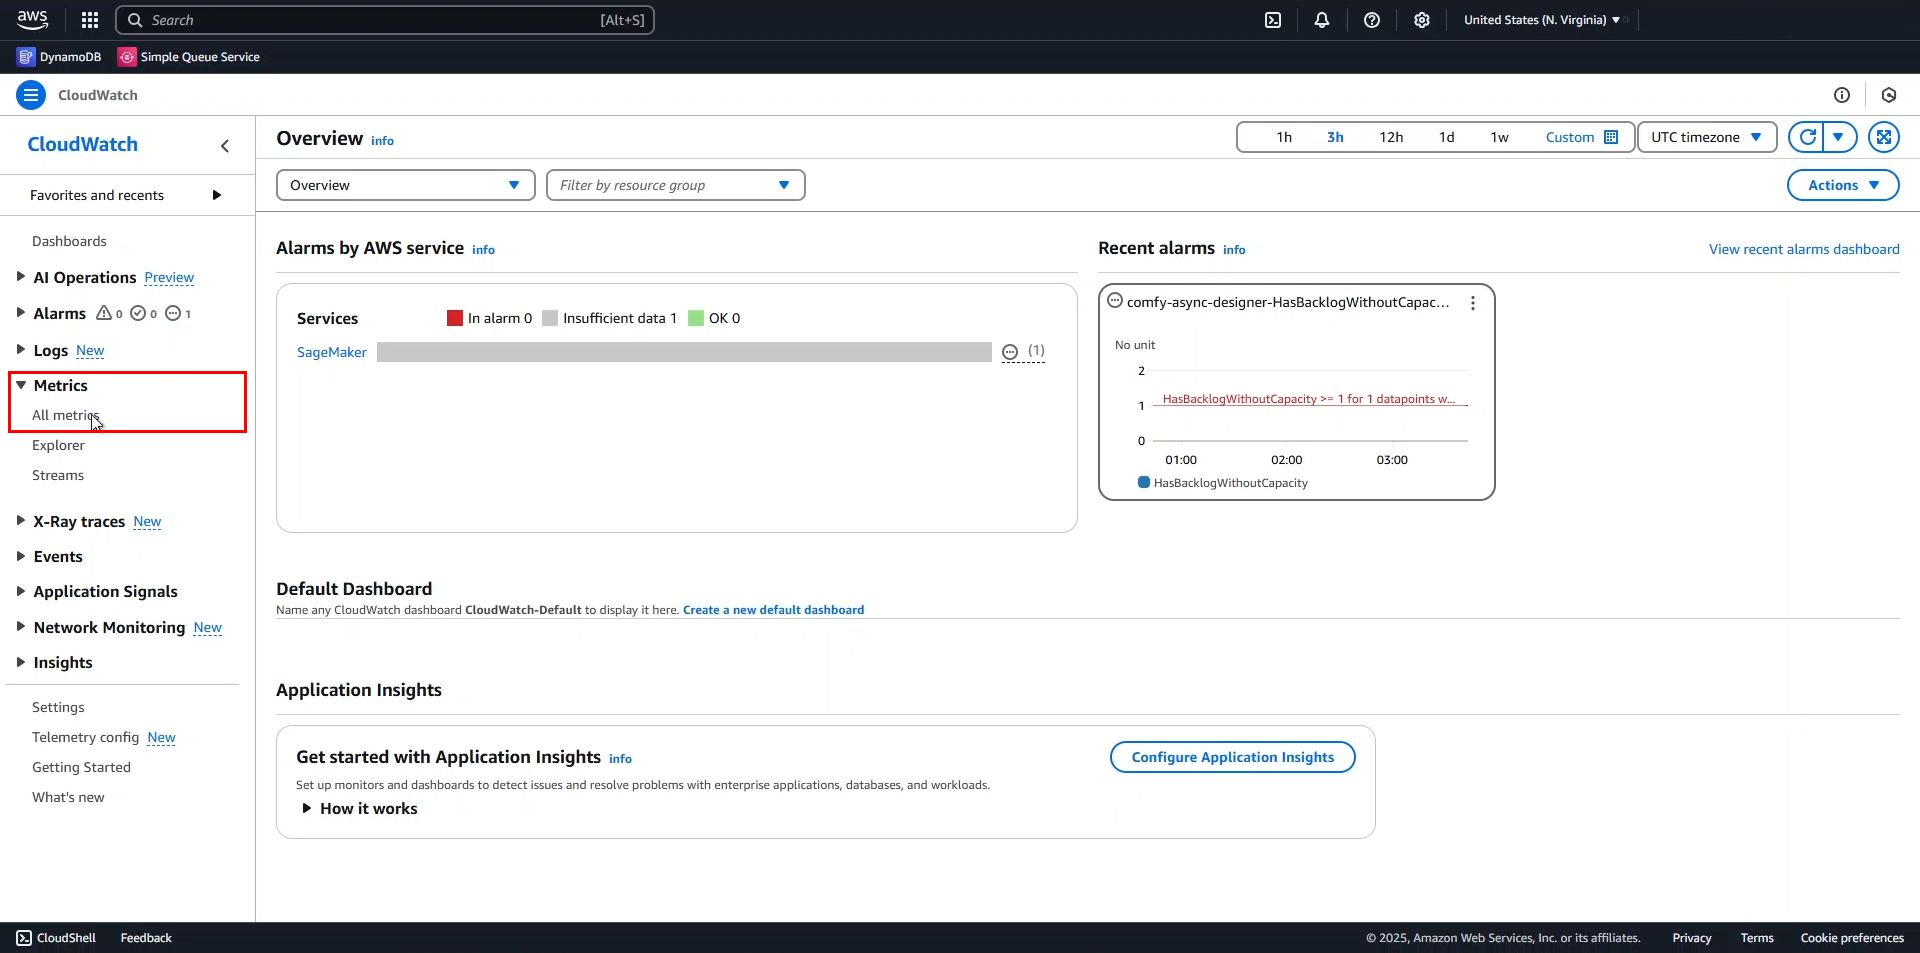
- In the CloudWatch interface
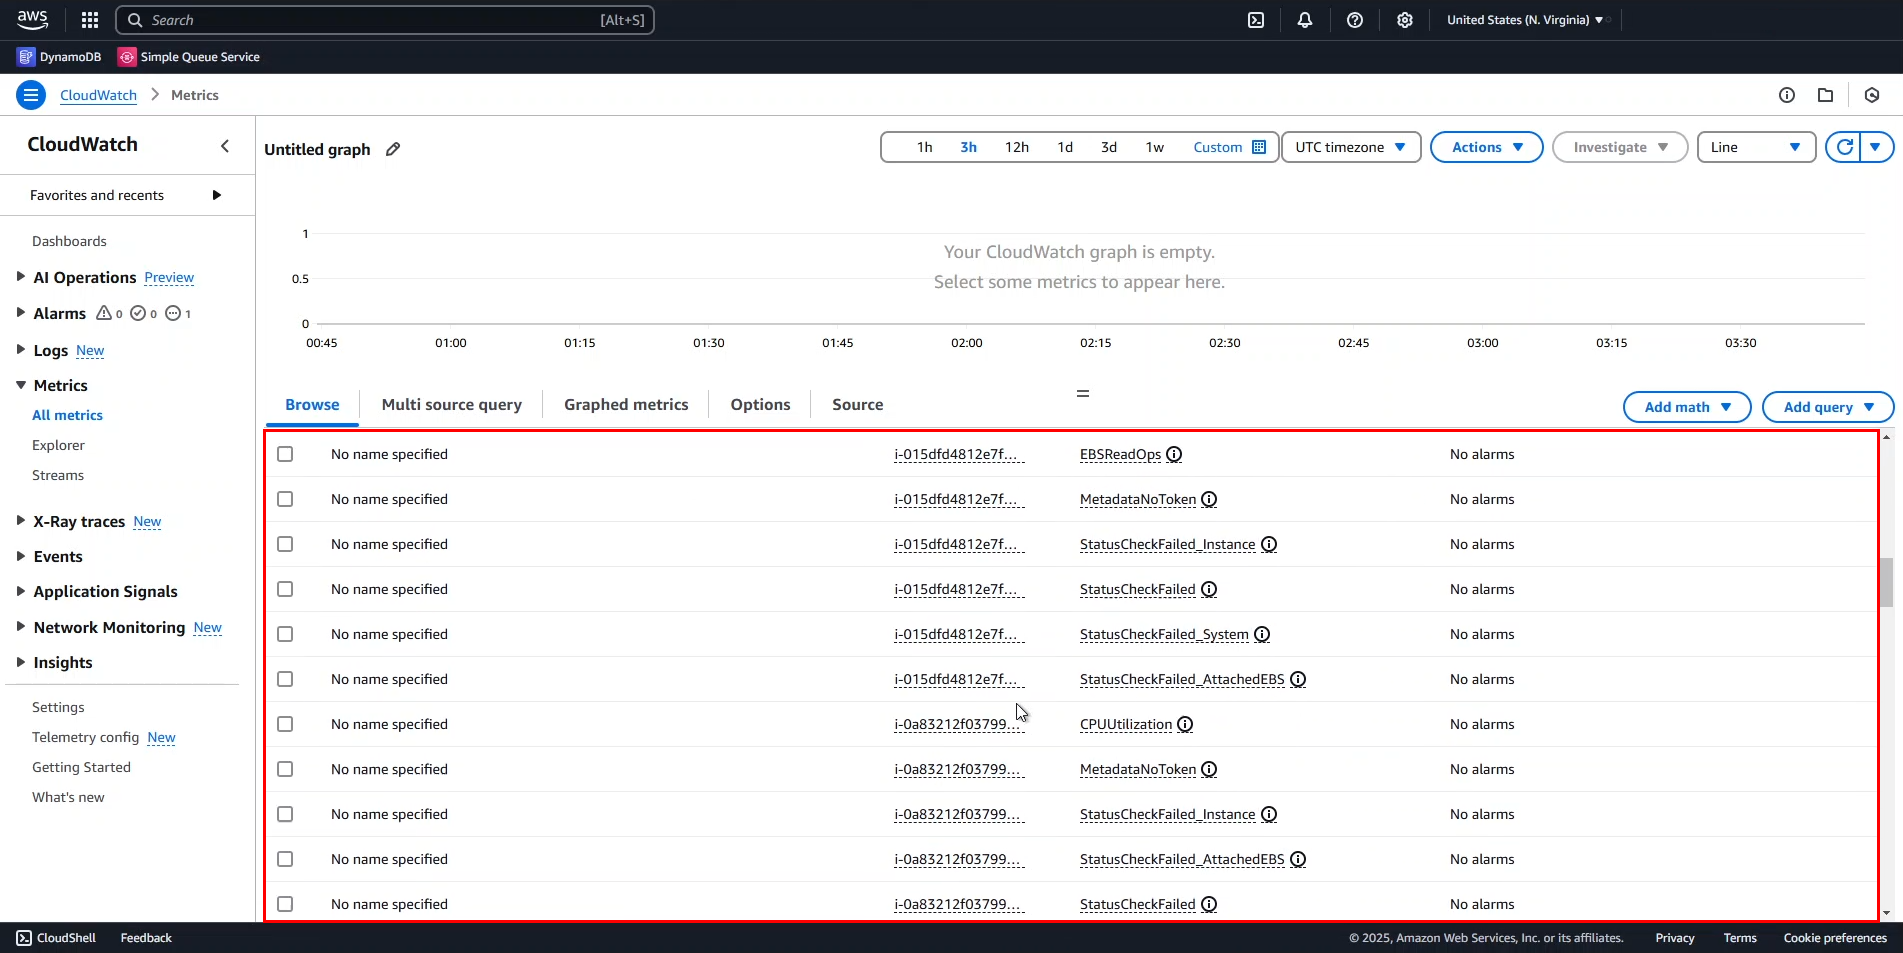
- Expand the Metrics section in the left menu.
- Select All metrics.
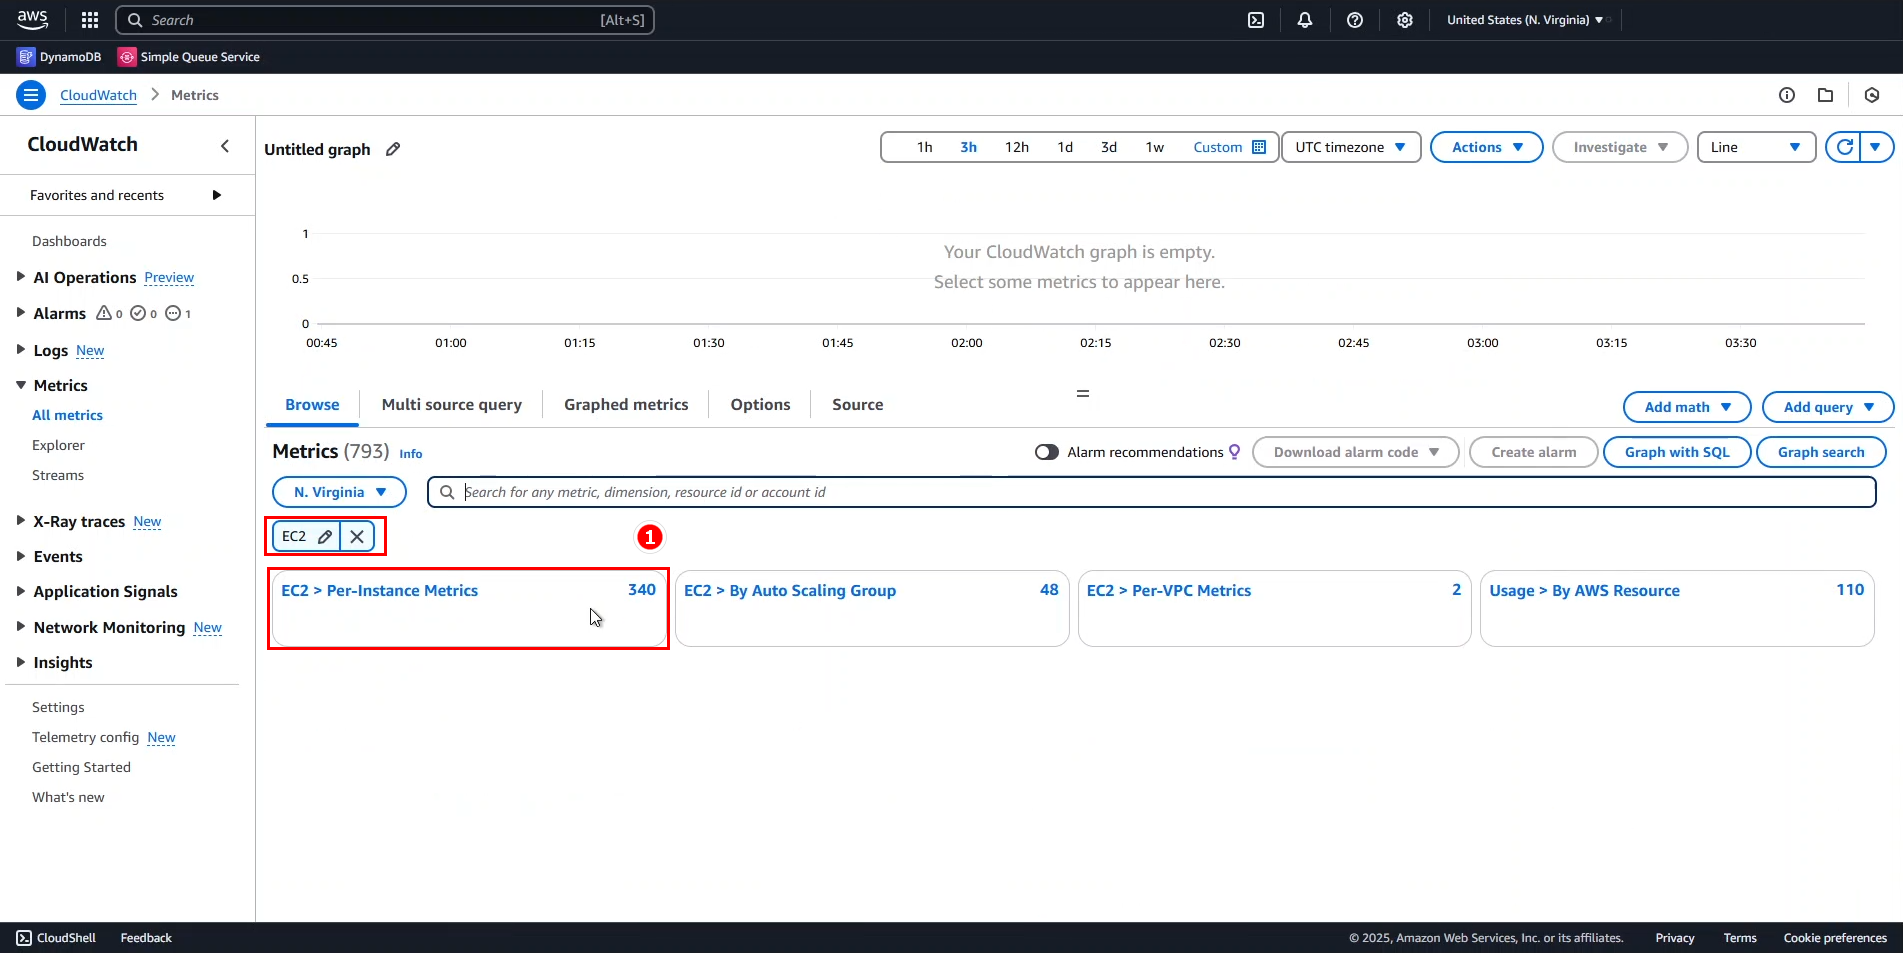
- In the metrics dashboard, enter
EC2in the search bar.
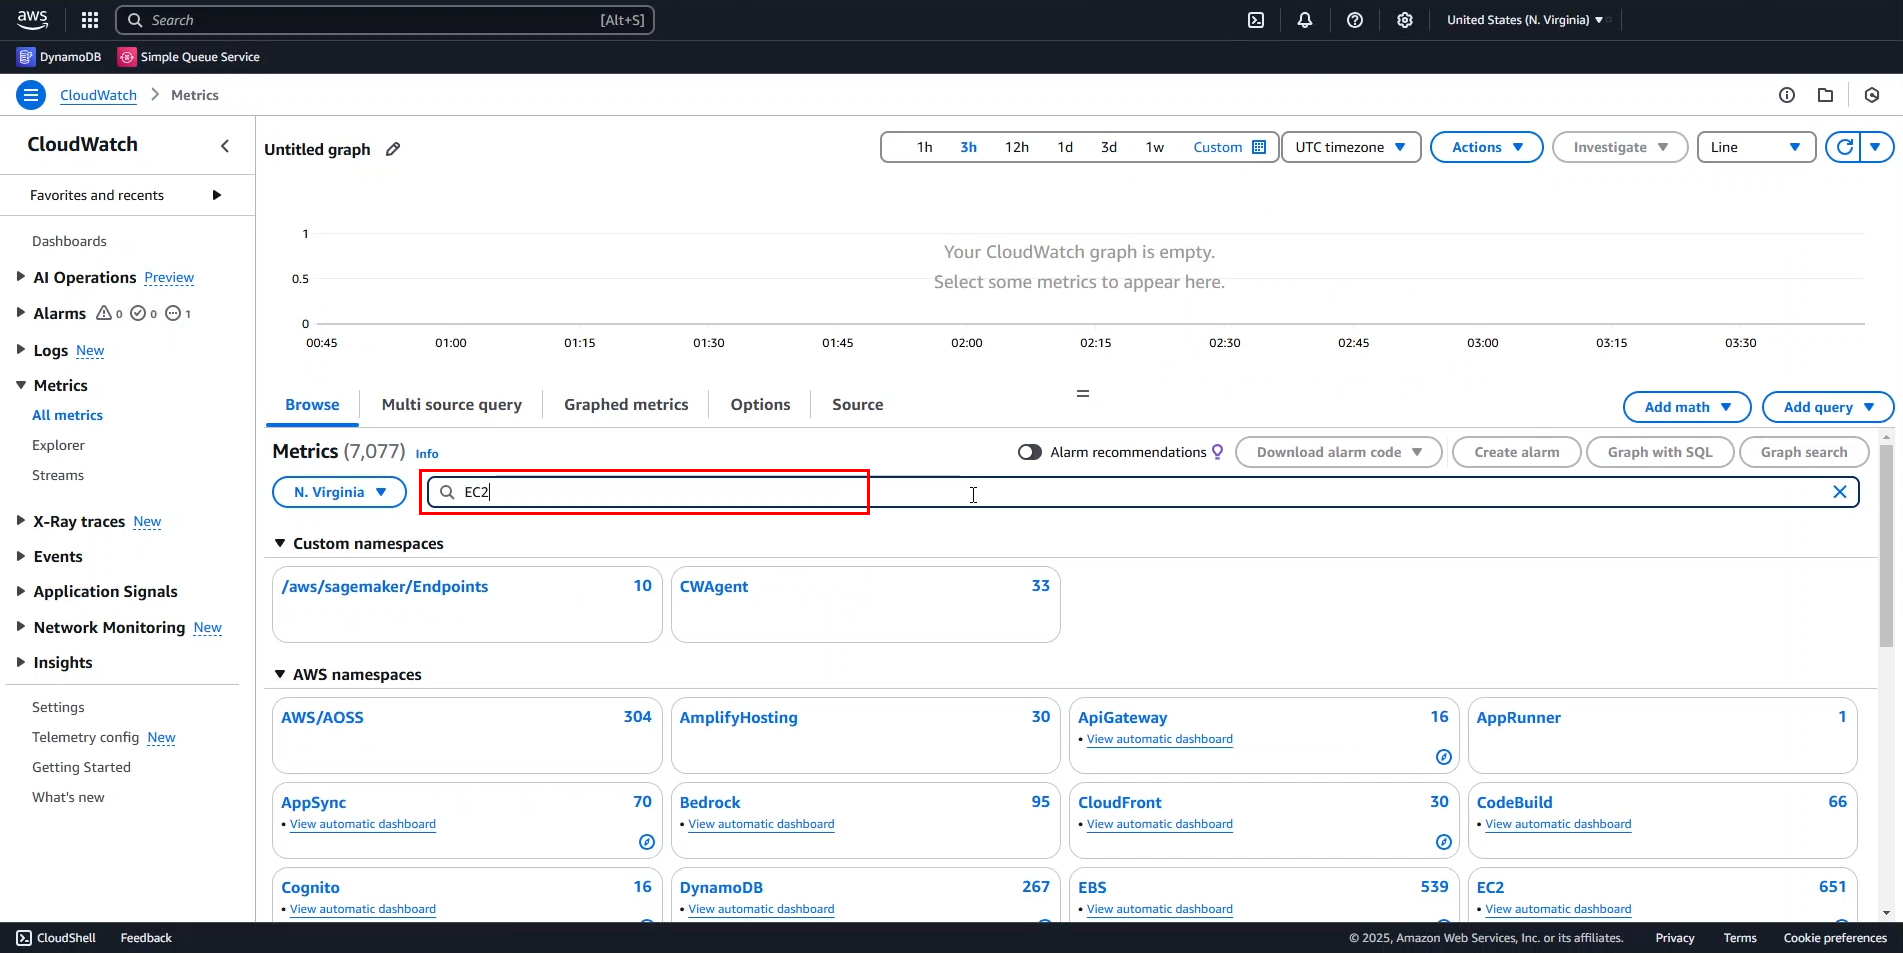
- Once the results appear, select EC2 > Per-Instance Metrics.
- In the search bar, type
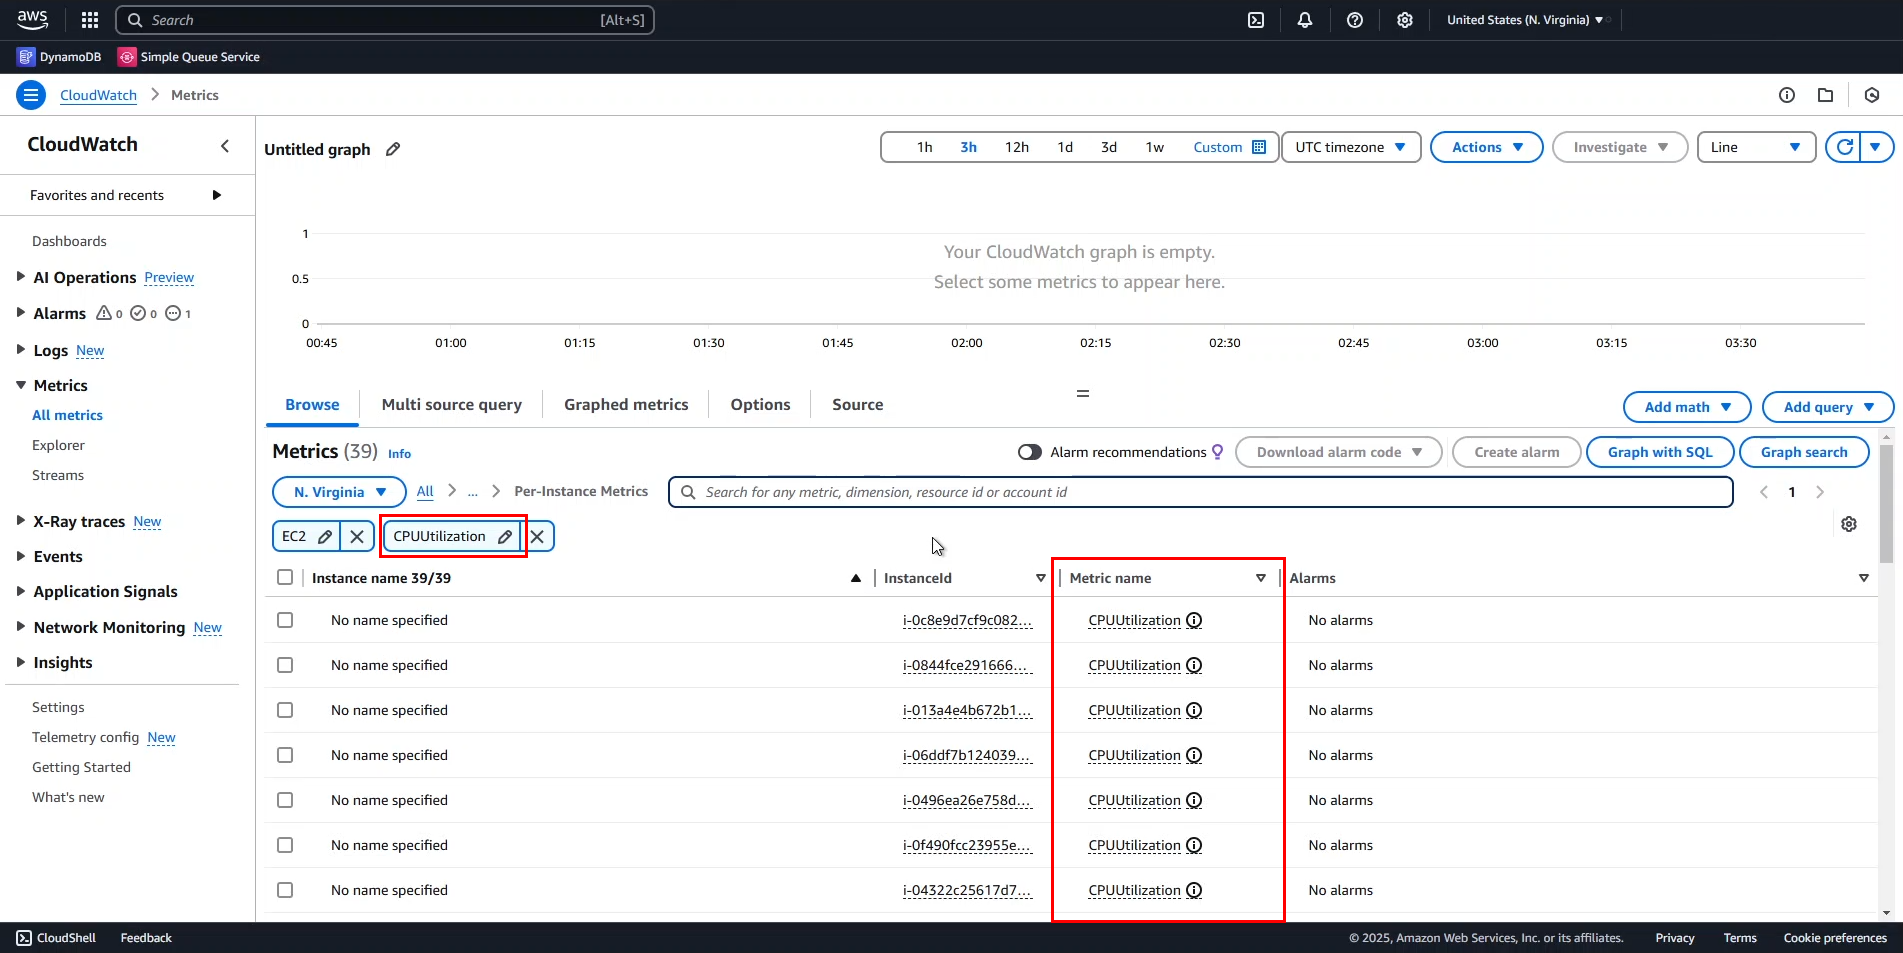
CPUUtilizationand search.
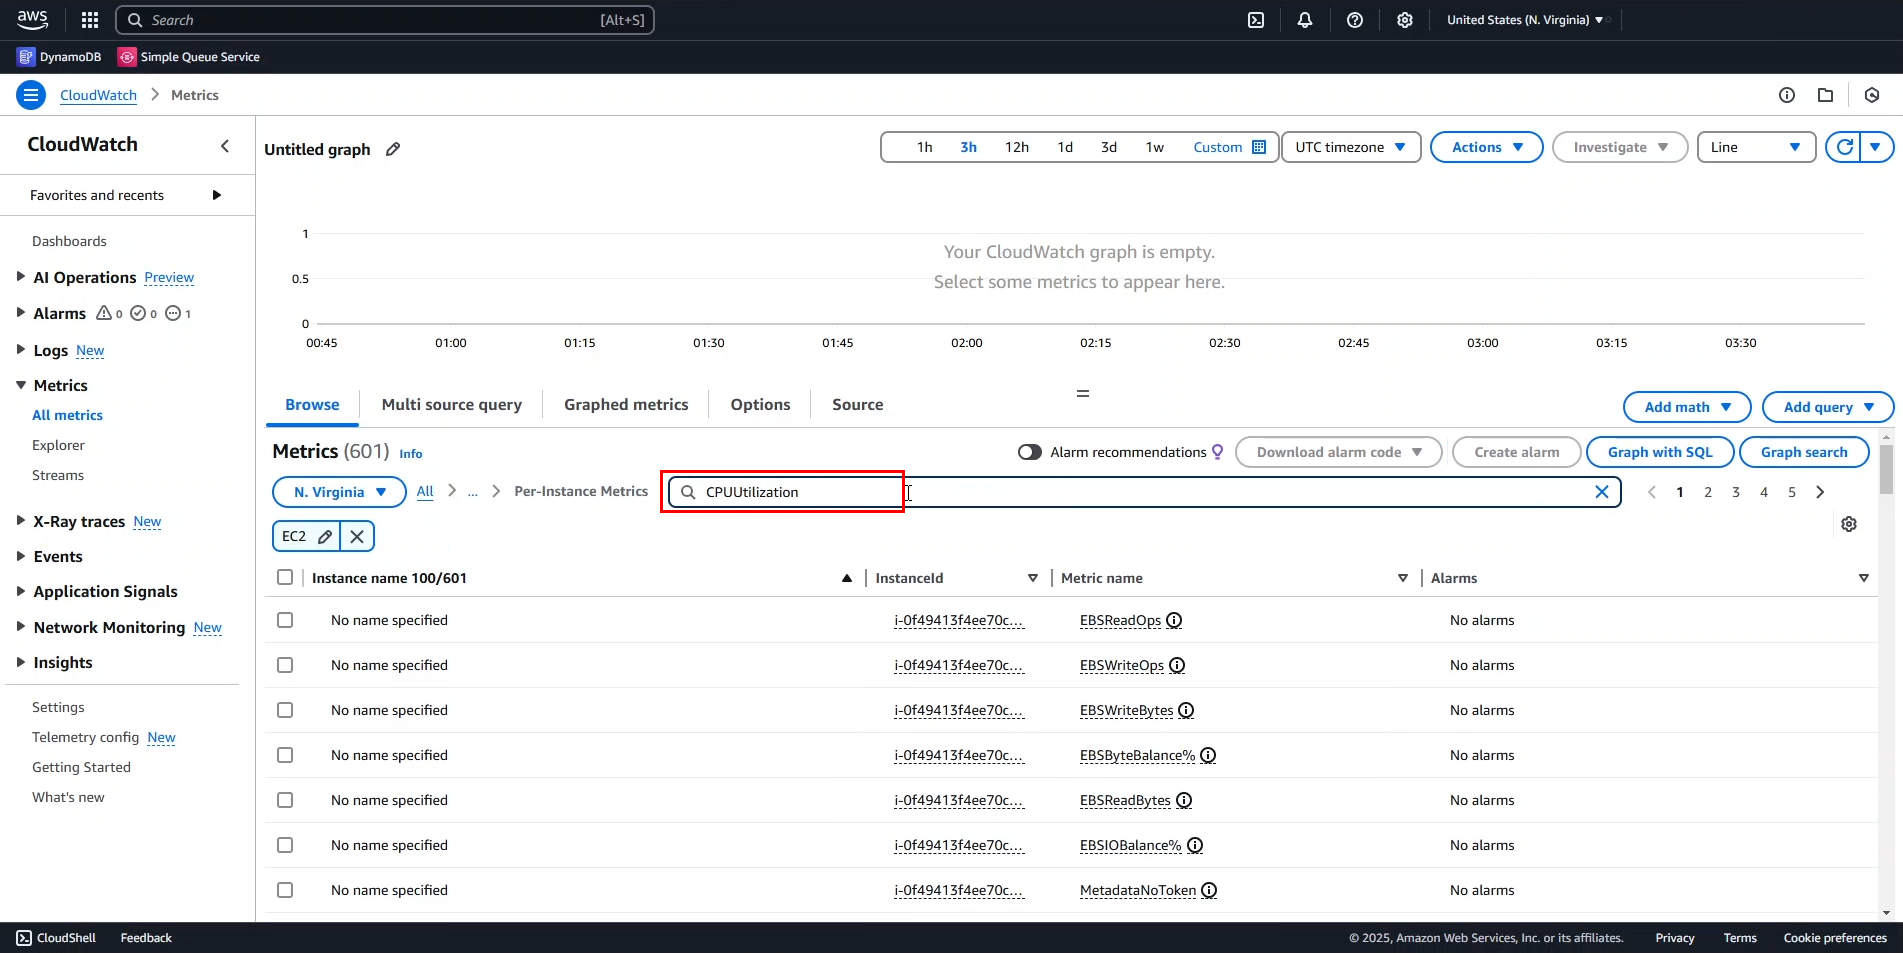
By default, the search is performed by Metric name.
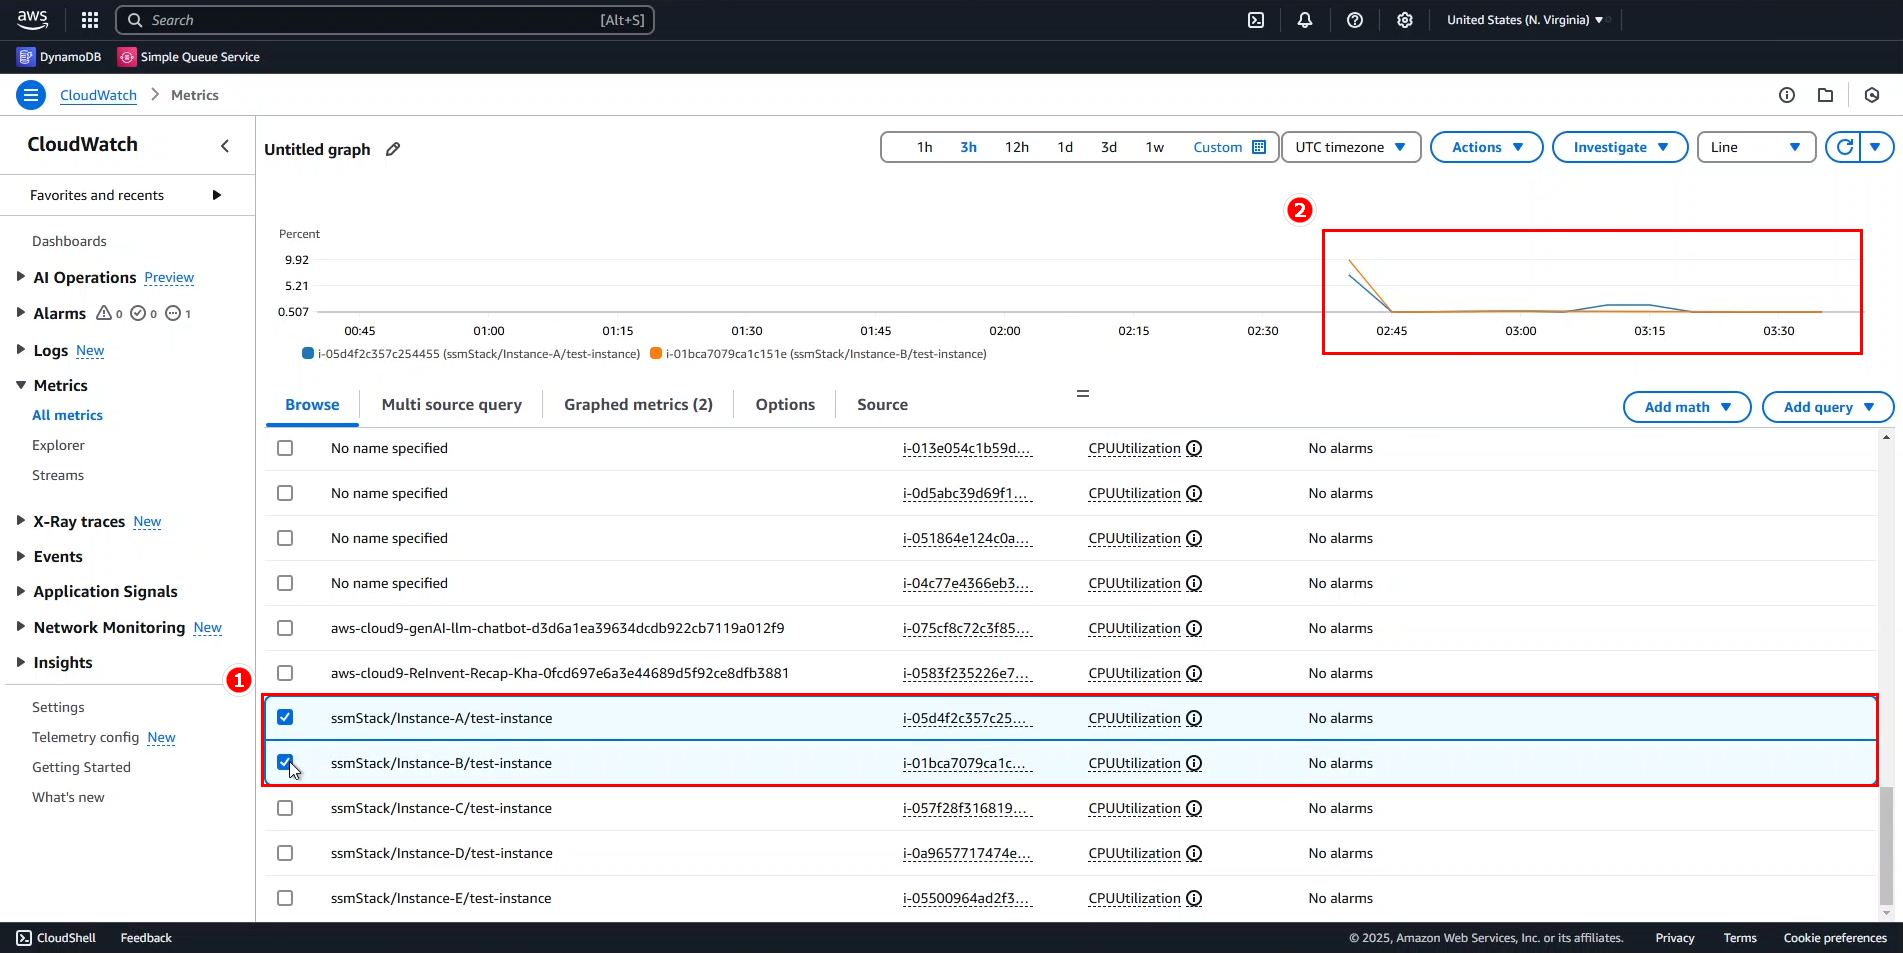
- Add two out of the five instances created by the CloudFormation stack to observe their
CPUUtilizationmetrics.
Scroll down to view the data.
From the graph, we can conclude:
- Both instances started operating around 2:40 AM, which is also when they had the highest activity.
- By 3:30 AM, both instances seem to have completed their tasks.
- Viewing additional metrics for a single instance
- Deselect the line for Instance B.
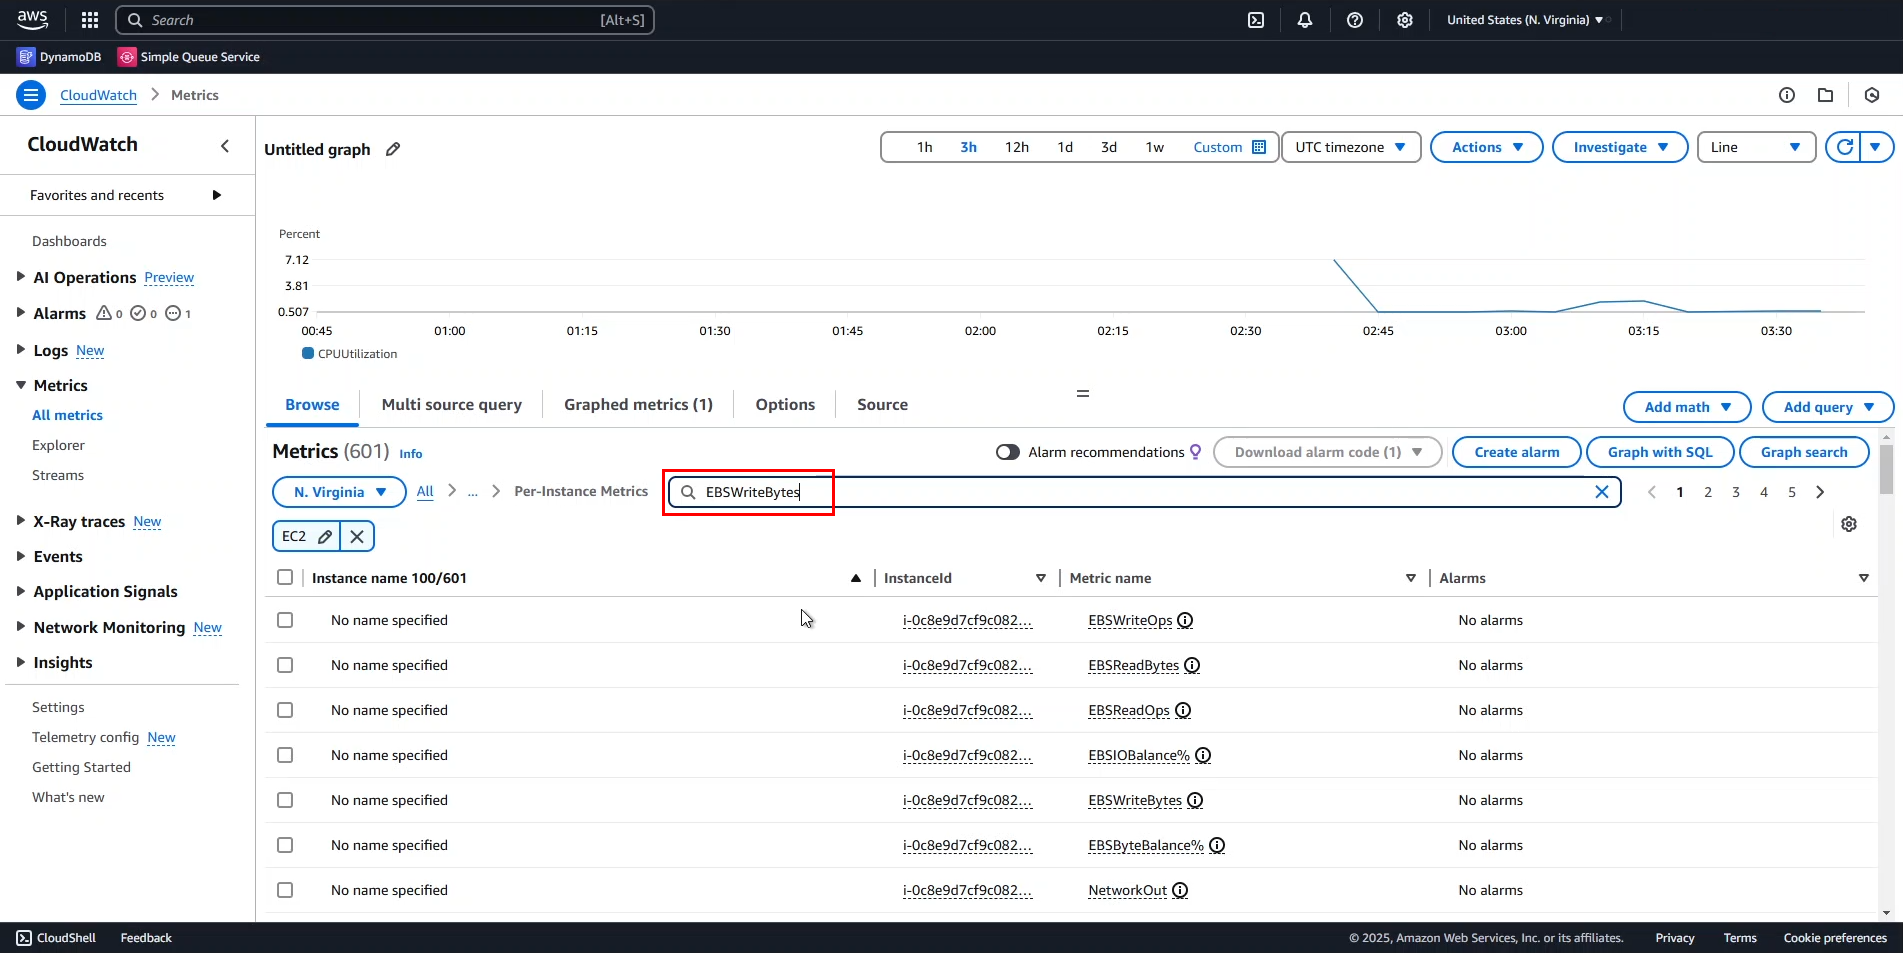
- Remove the CPUUtilization filter.
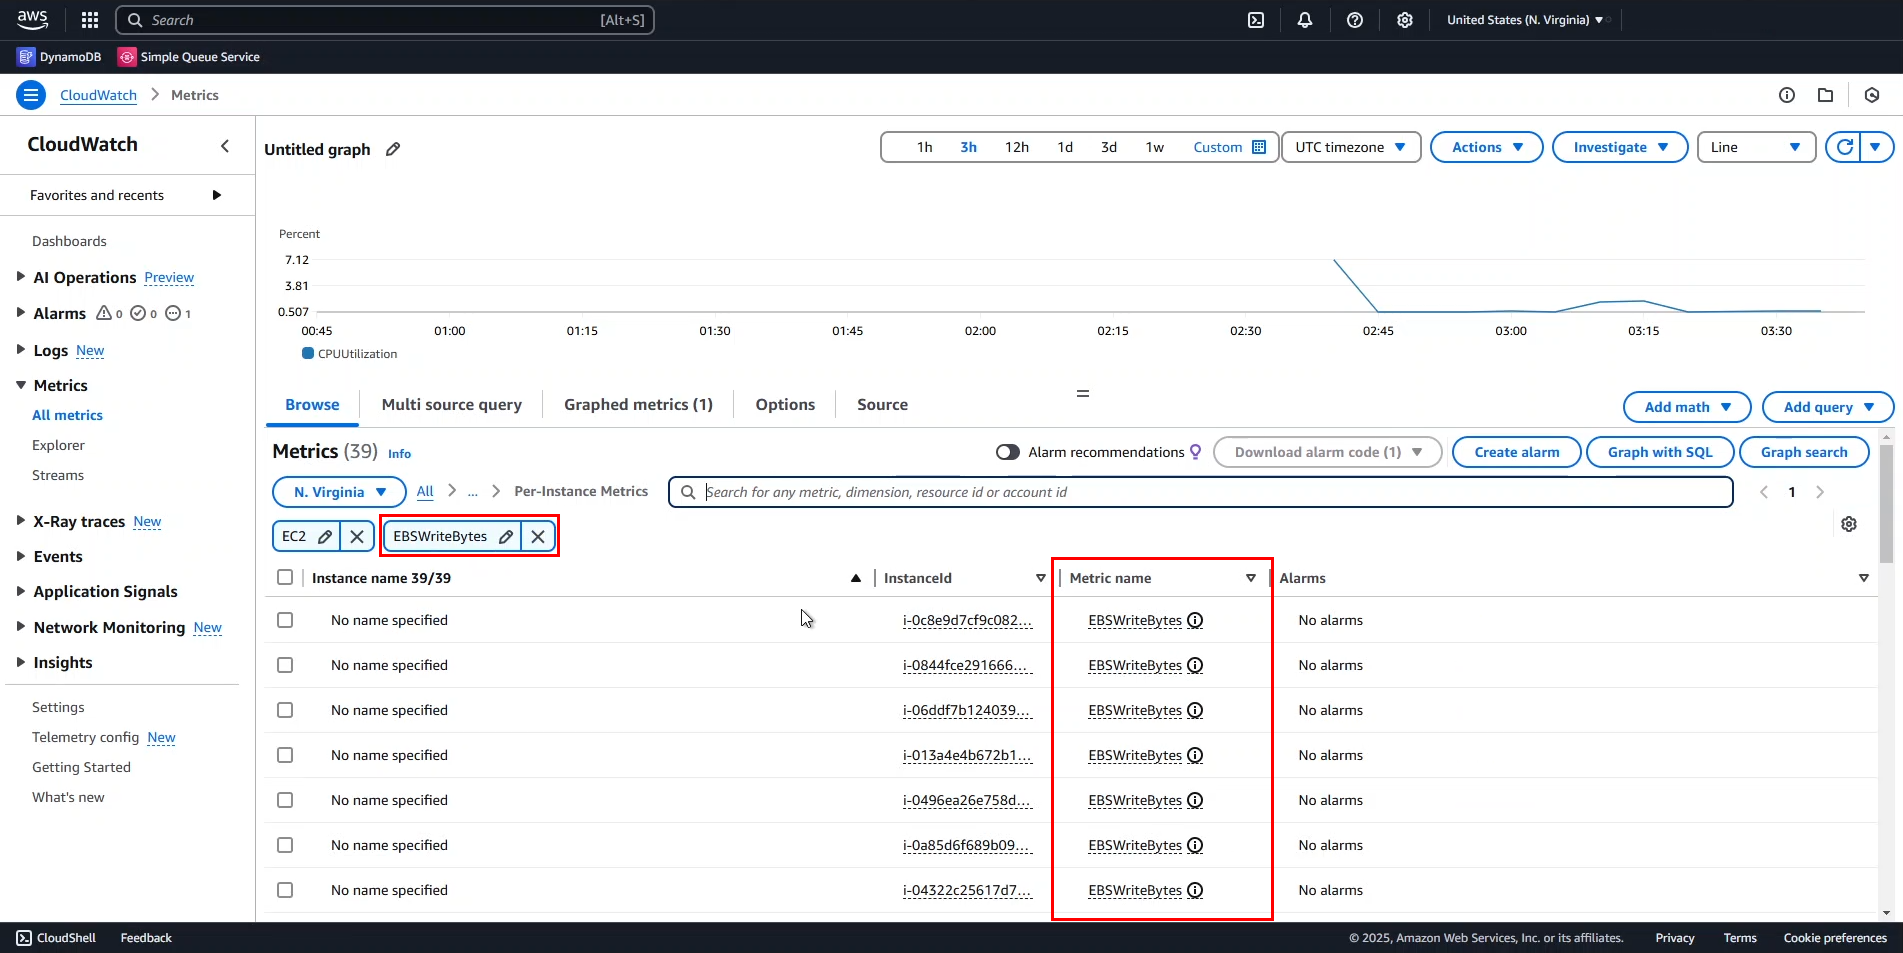
- In the search bar, enter
EBSWriteBytesand search.
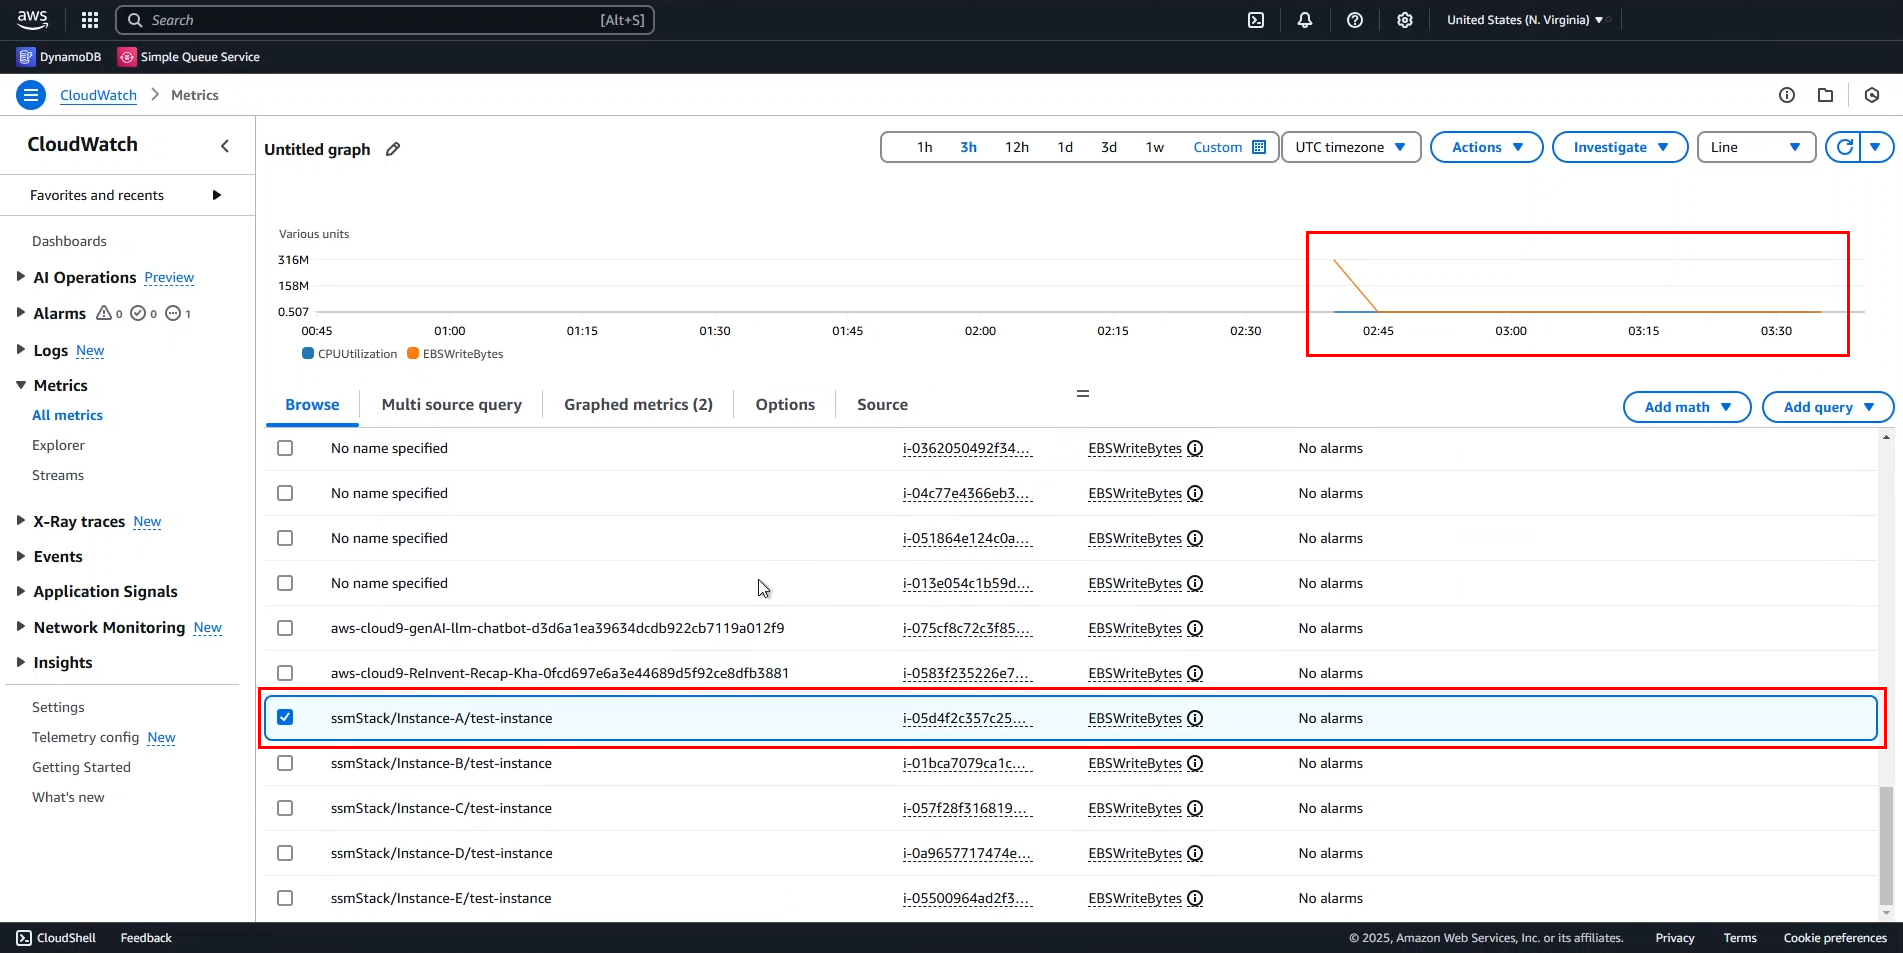
- Scroll down and select Instance A.
From this chart, we observe:
- Initially, there was a high volume of read/write operations to EBS, indicating that the instance was processing data.
- CPUUtilization and EBSWriteBytes follow a similar pattern, except at certain points where they diverge.
- This suggests that the application interacts with EBS mainly during startup but performs other tasks afterward.
You can hide one of the metrics to analyze the data more clearly.
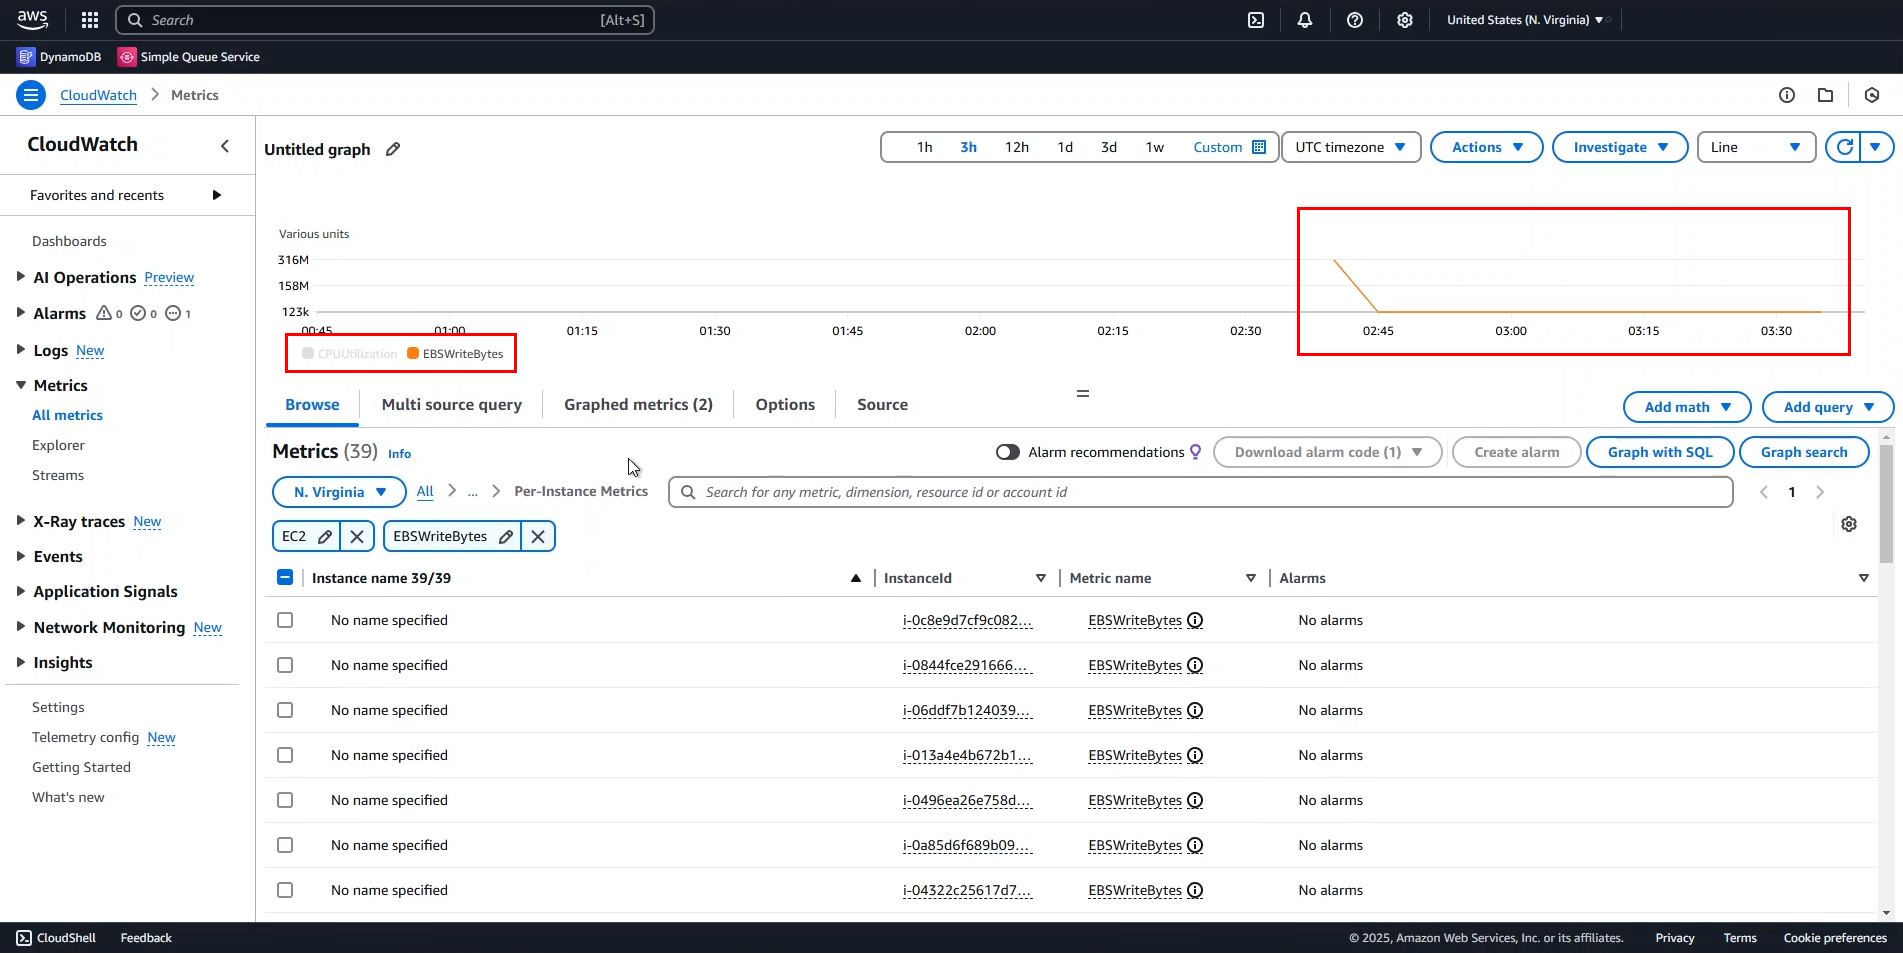
However, we will take a better approach in the next section by customizing the charts for improved visualization.
Working with Charts
In the previous step, our chart was difficult to interpret because both CPUUtilization and EBSWriteBytes were plotted on the same Y-axis. Now, we will separate them and add markers for better visualization.
- Adjusting the Y-axis
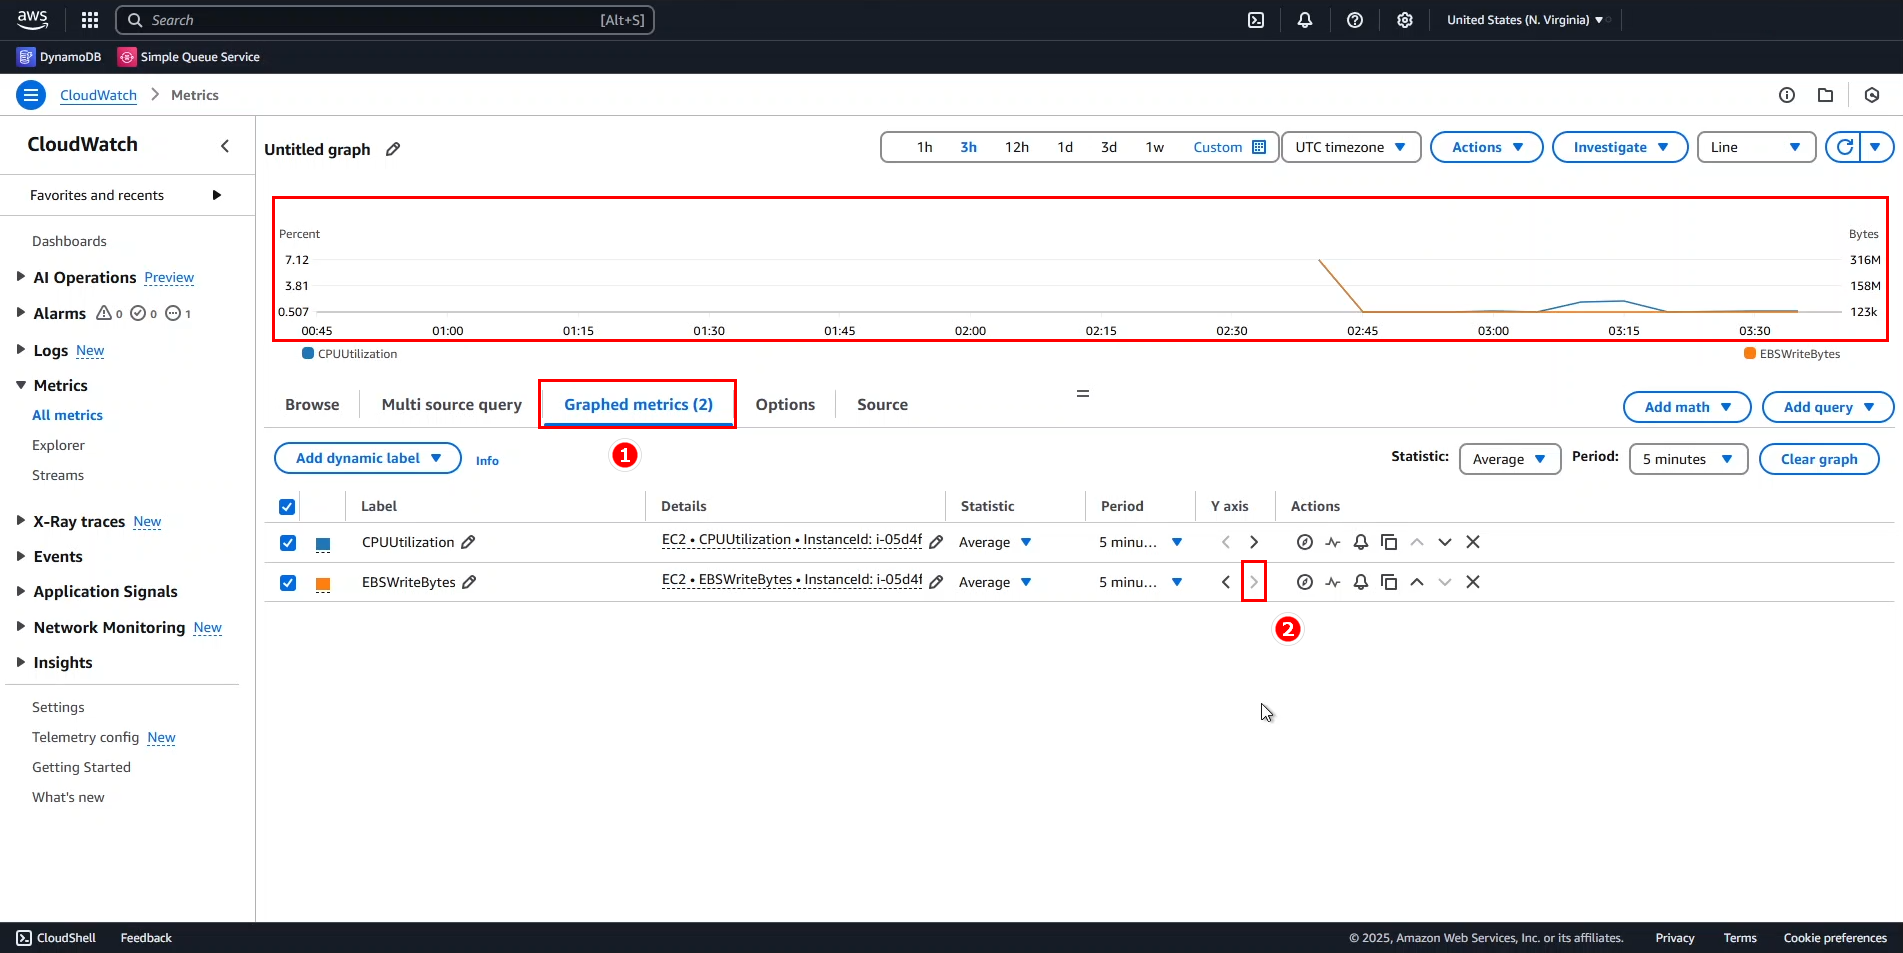
- Go to the Graphed metrics tab.
- Locate EBSWriteBytes, then under the Y-axis column, select >.
- The chart should now appear more readable.
- Adding a horizontal annotation (threshold marker)
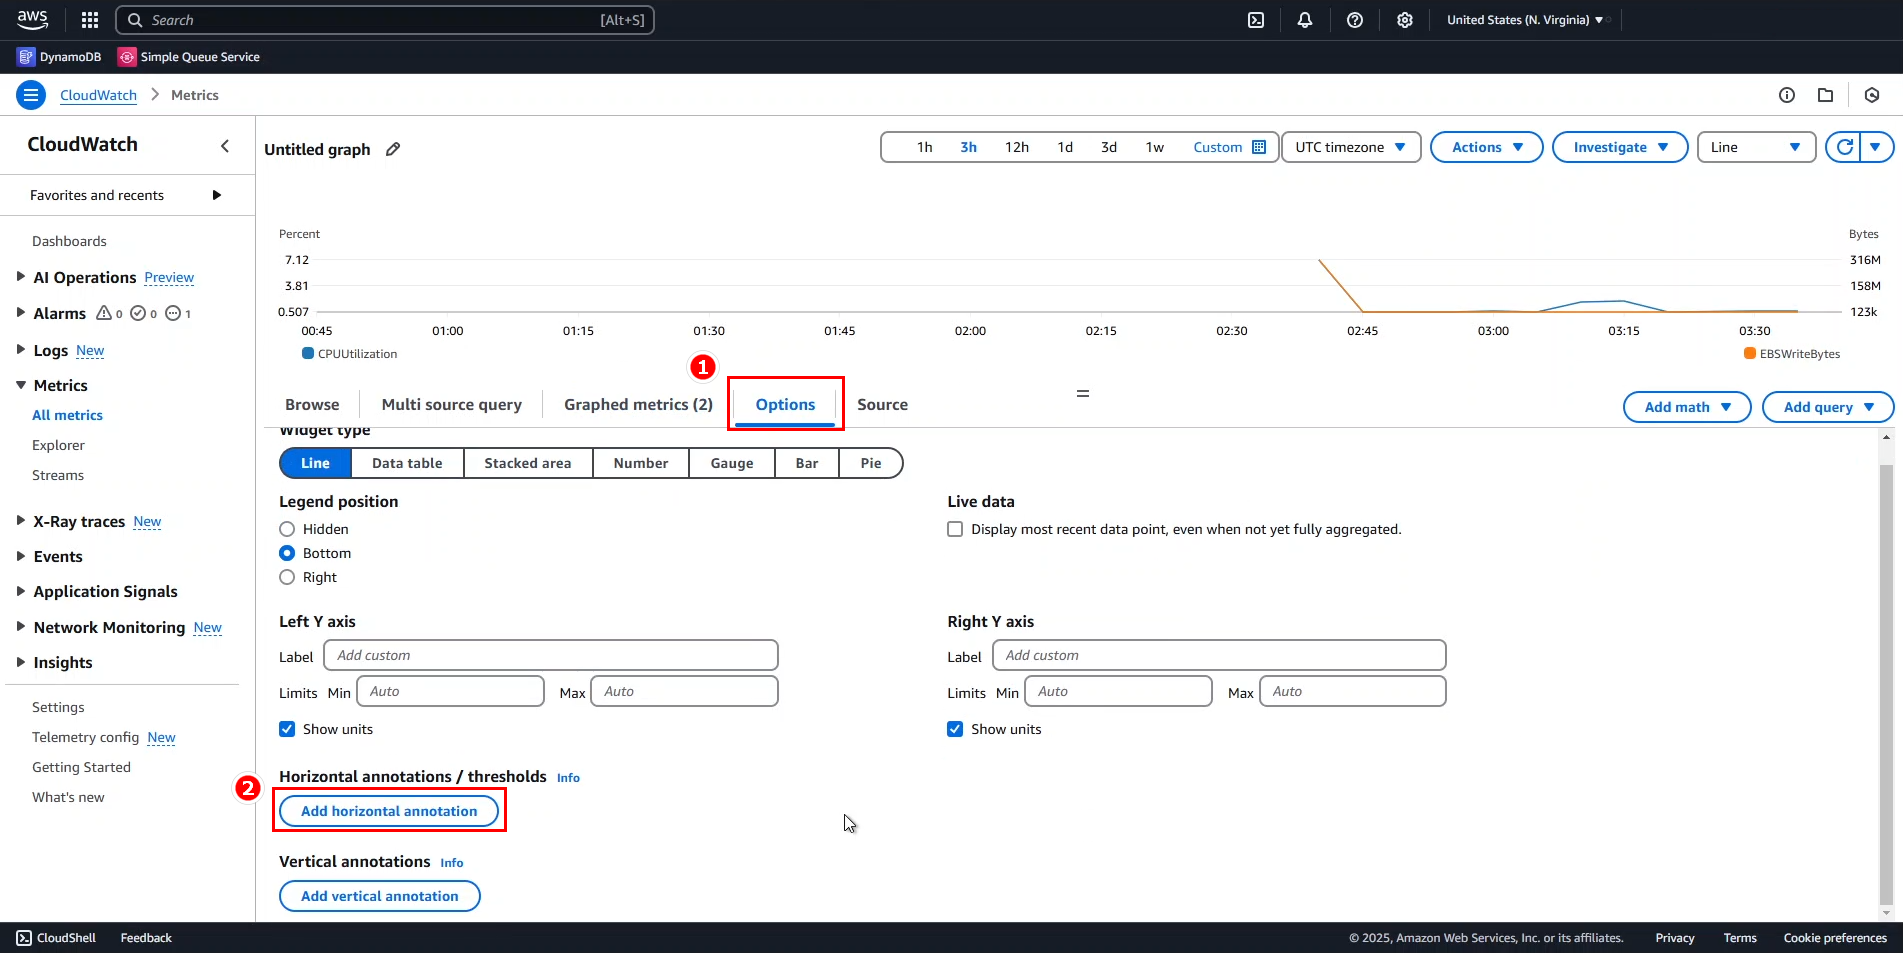
- Go to the Options tab.
- Click Add horizontal annotation.
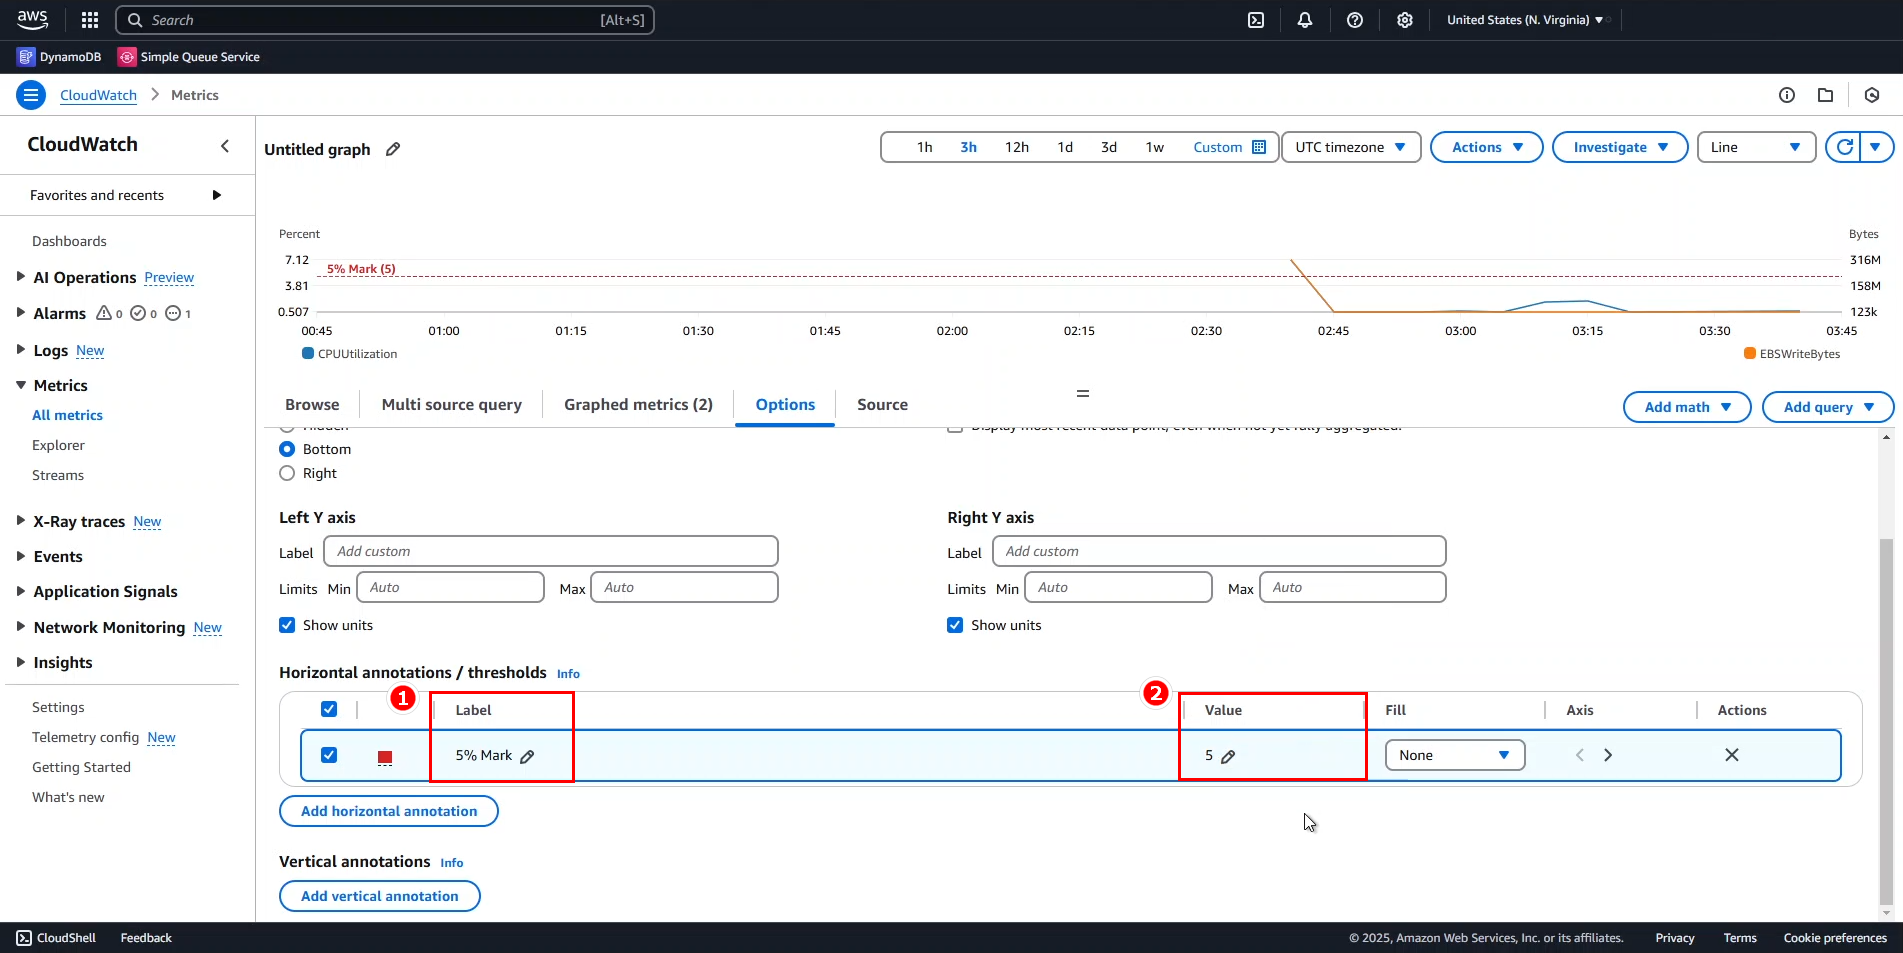
- Enter annotation details:
- Label:
5% Mark - Value:
5
- Label:
This adds a dashed line on the chart, labeled accordingly.
- Adding a vertical annotation (event marker)
- Create a Vertical annotation labeled
Job start. - A dashed vertical line appears on the chart.
- Create a Vertical annotation labeled
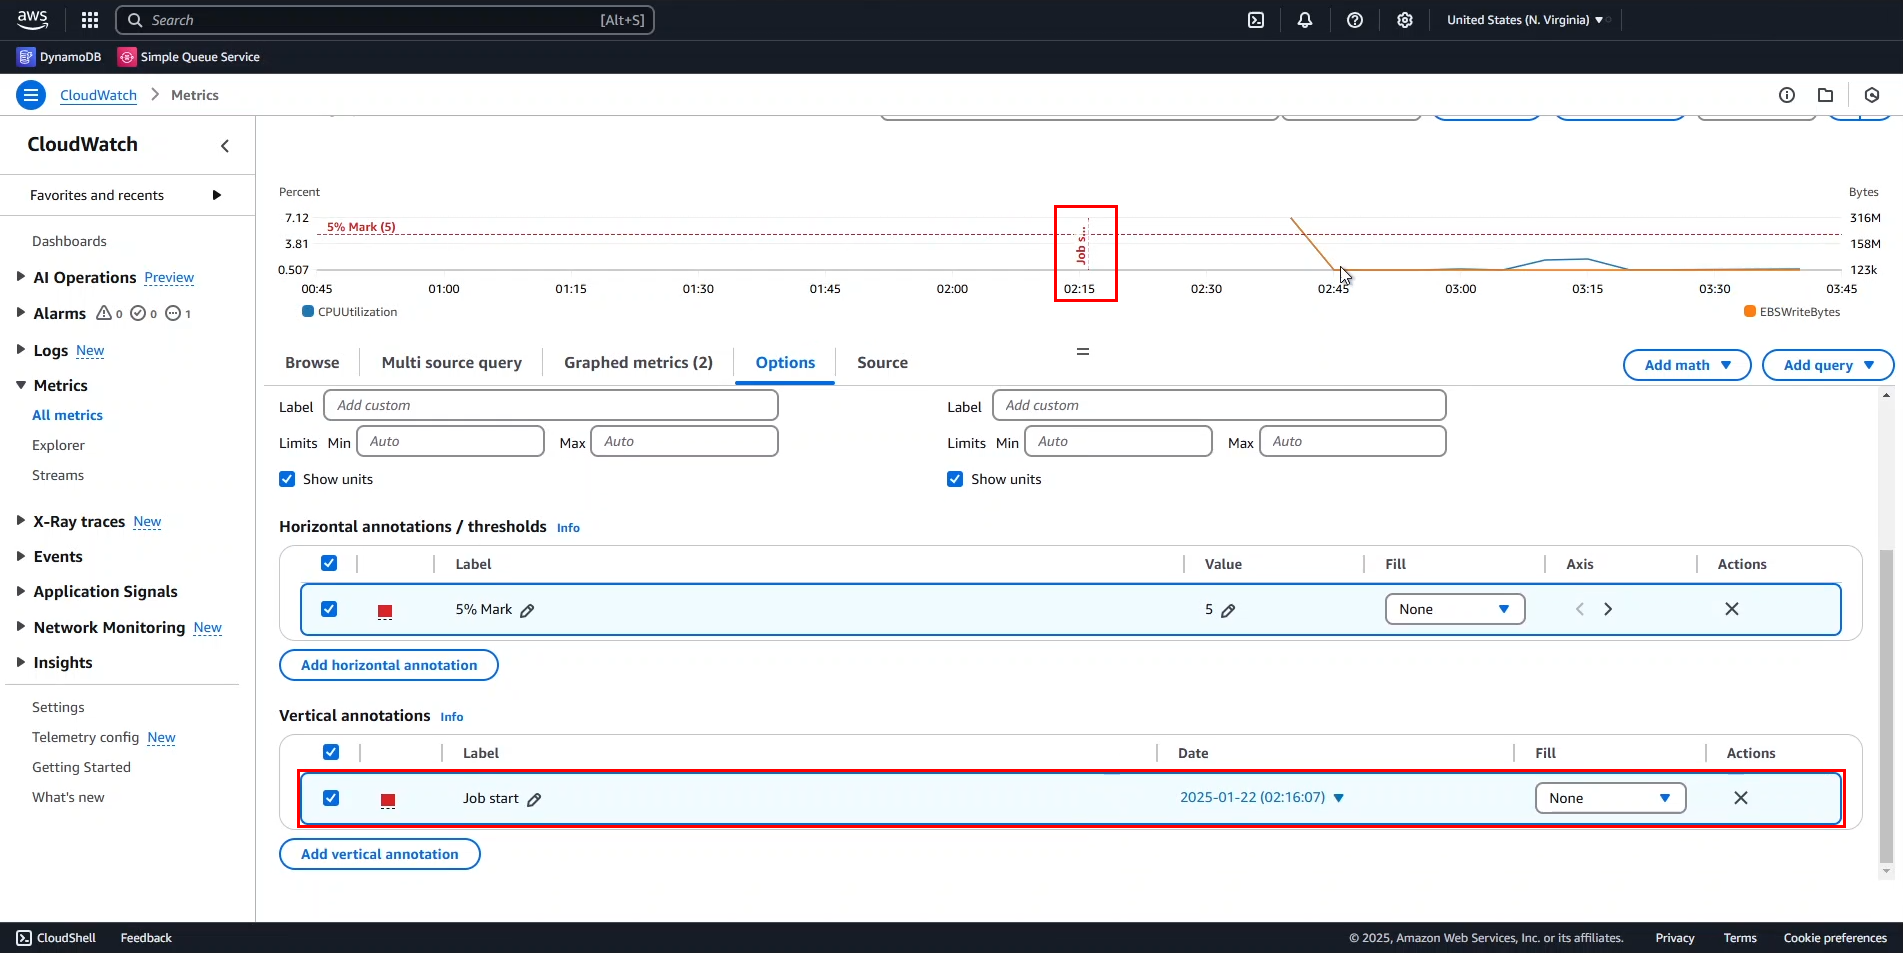
By default, the Job start marker is set at 2:16 AM, but this is incorrect. We need to adjust it.
- Adjusting the vertical annotation time:
- Hover over the Job start marker.
- The job actually started around 2:40 AM.
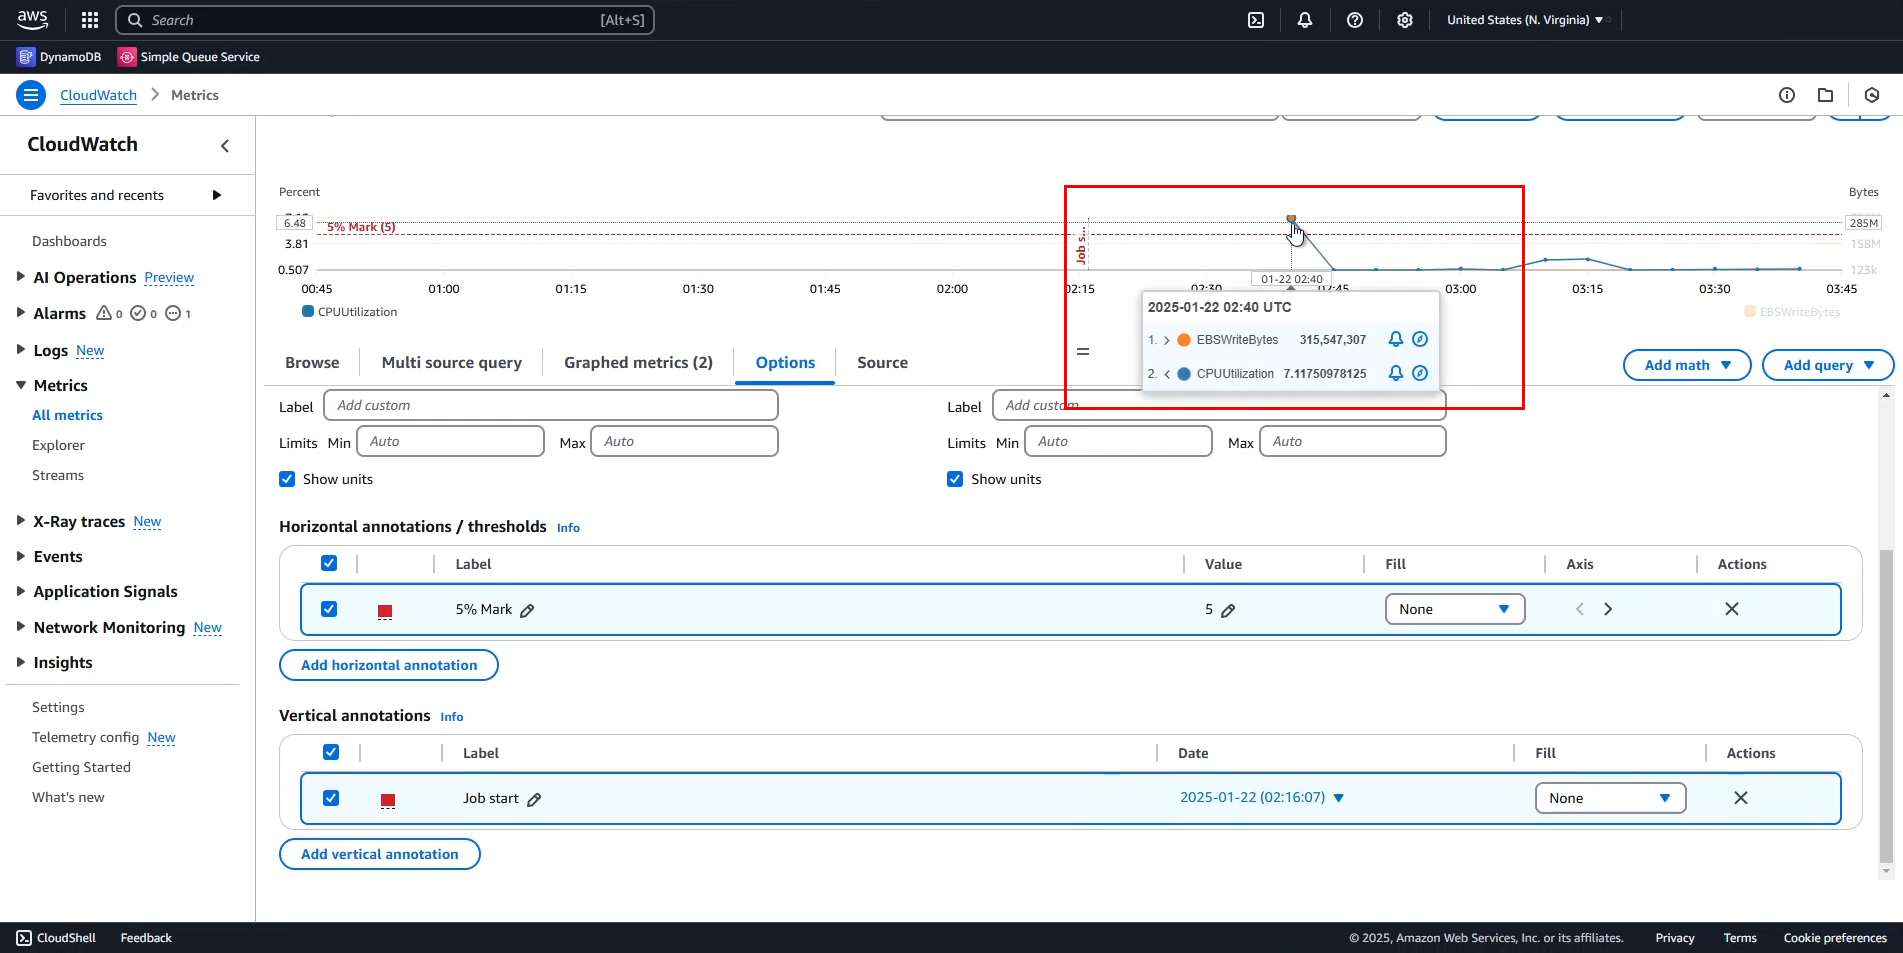
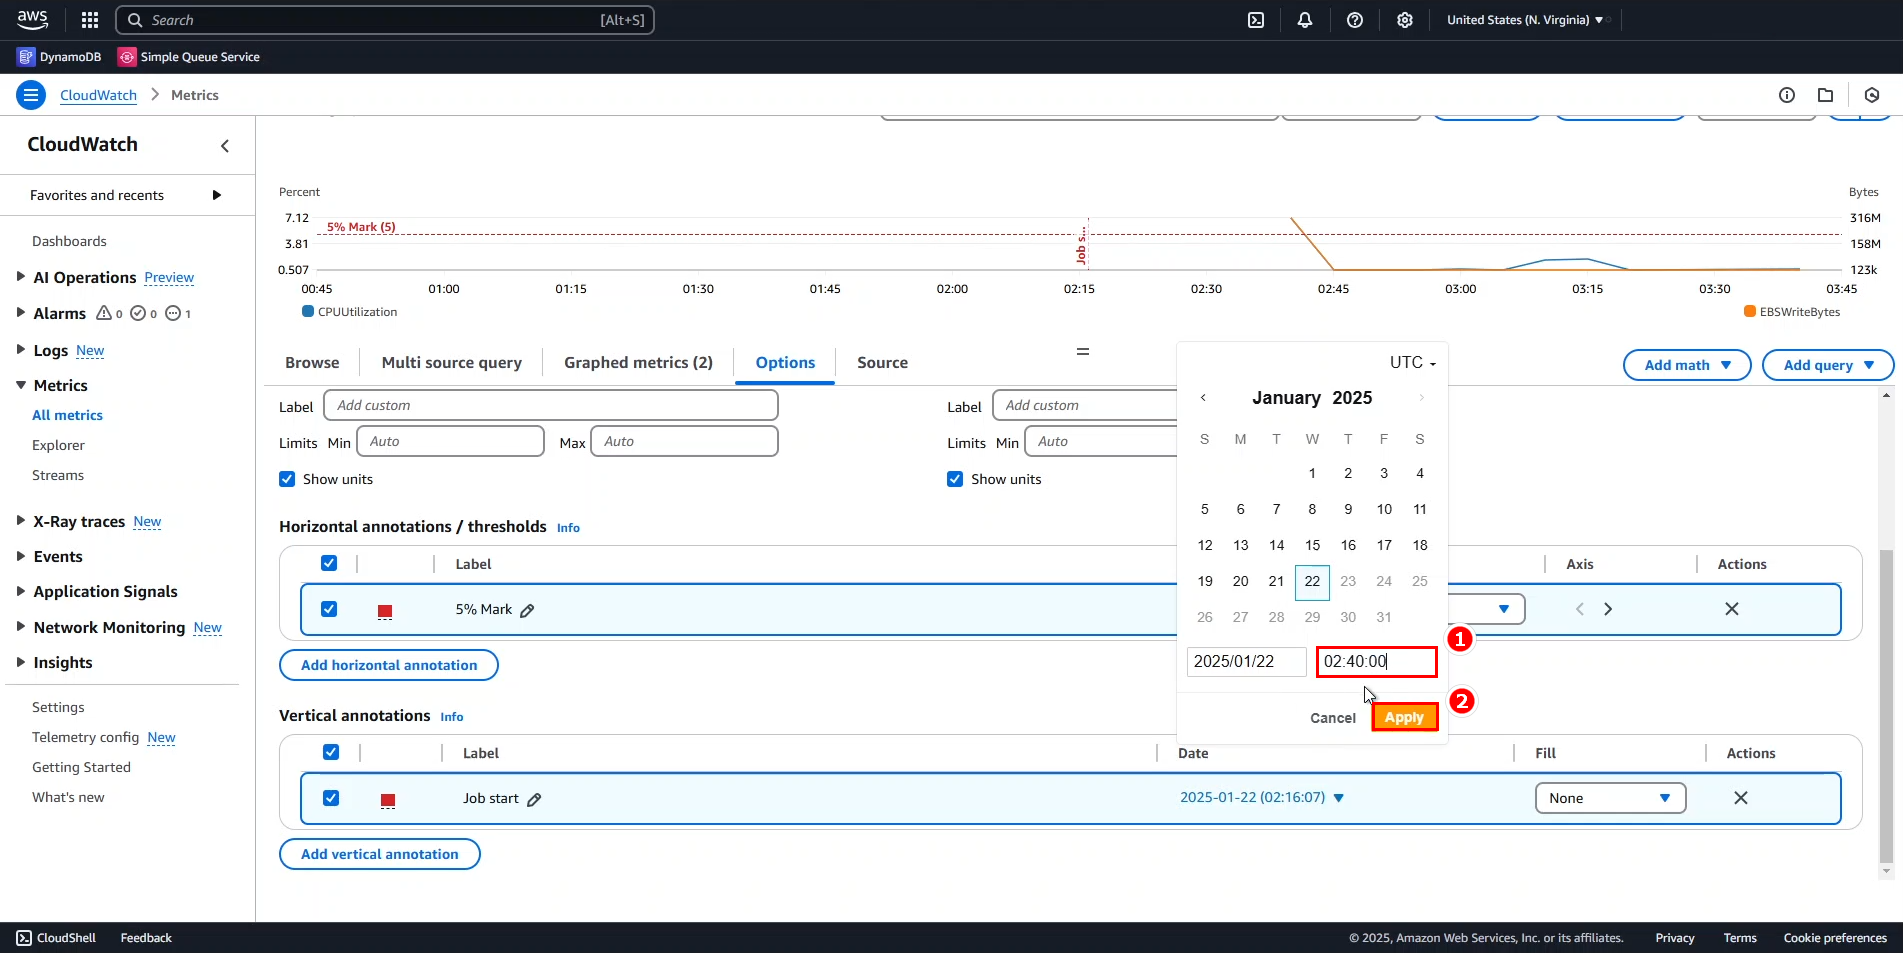
- Change the Date/Time for
Job startto 2:40 AM. - Click Apply to save changes.
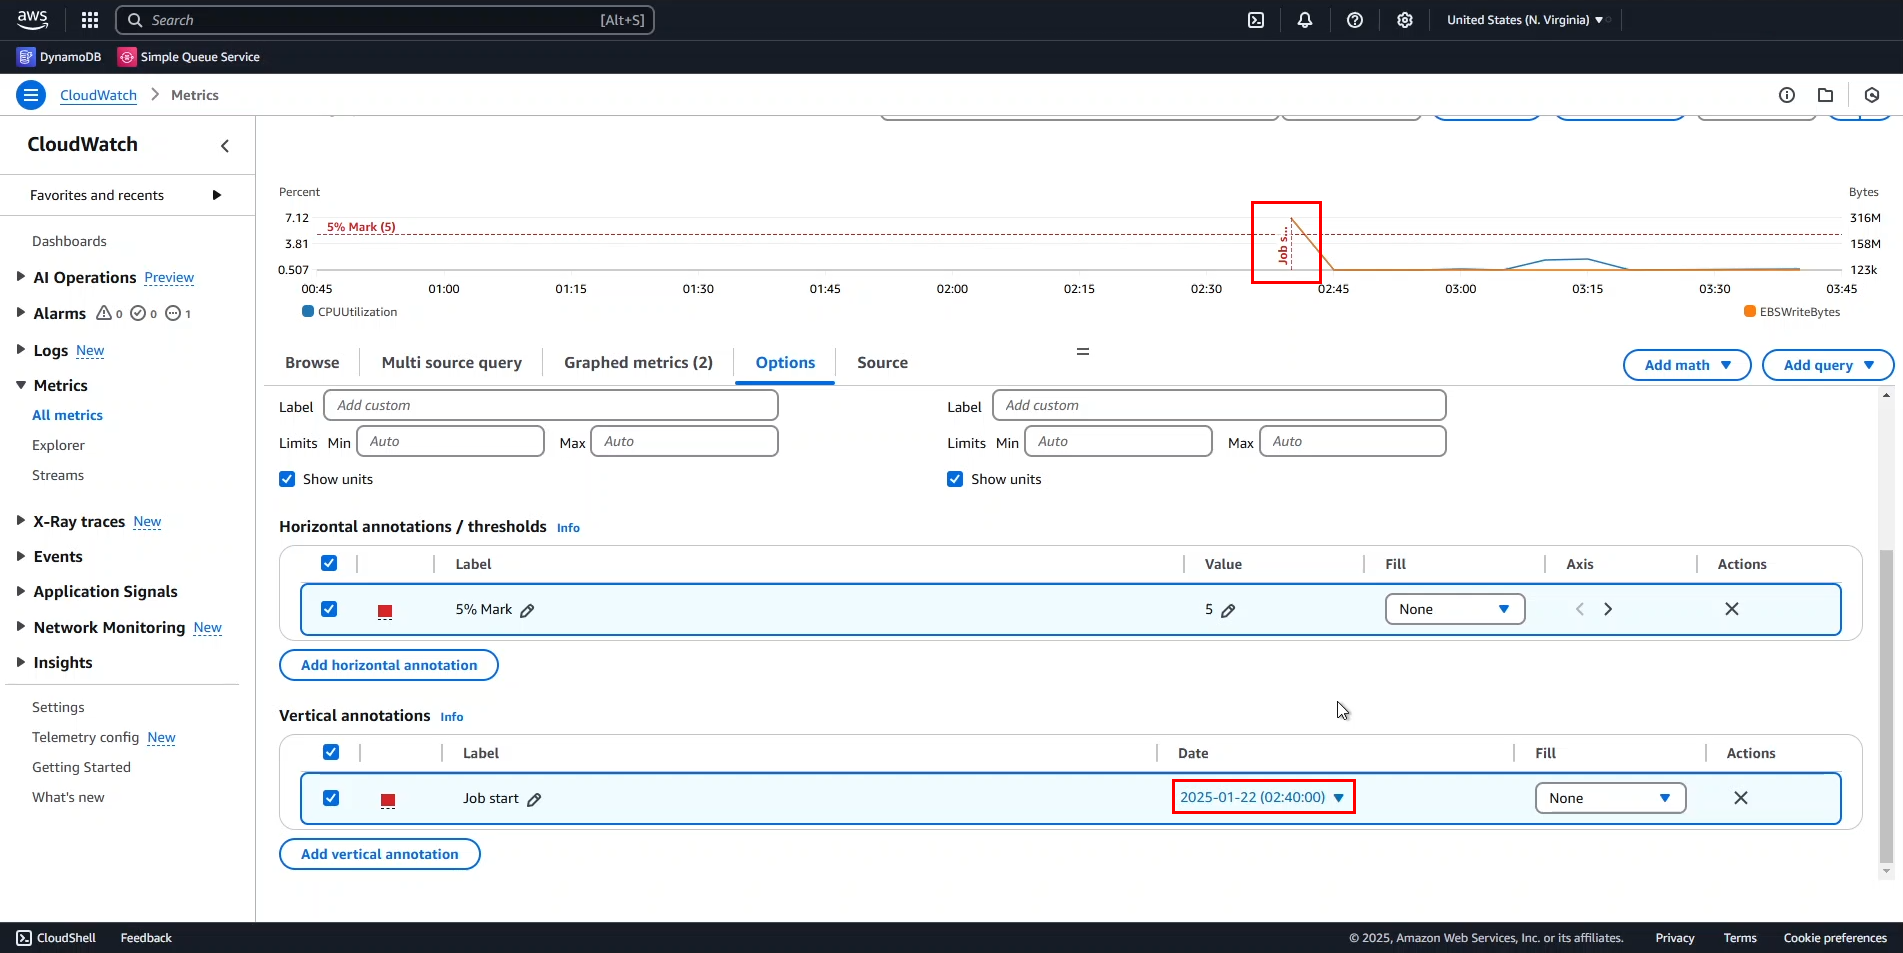
The Job start marker has now been repositioned.
That concludes our hands-on work with charts.
In the next section, we will focus on working with metric expressions. You can remove the markers before proceeding to the next step.